Categories
The game plan for bonds? Consider active ETFs.
KEY TAKEAWAYS
  • It may be time to fortify core bond allocations. As the threat of a U.S. recession looms, bonds can provide diversification from equities.
  • Tax-loss harvesting opportunities abound. Consider harvesting your clients’ losses before markets recover — and consider reinvesting assets in active fixed income ETFs.
  • Yields are very attractive at this stage of the cycle, even on traditionally lower risk fixed income assets — suggesting it may be an opportune time to invest. However, quality is important. Active fixed income ETFs can help you pursue value across sectors.
  • With interest rates and Federal Reserve policy uncertain, active fixed income ETFs can help you manage interest rate risk* and may provide greater tax efficiency to portfolios over the long term.

The higher rate environment has resulted in more attractive yields across fixed income, making it a compelling area to consider. Bonds are offering significantly higher yields without having to take on more risk, which means you don’t have to venture too far on the risk spectrum to pursue higher income in a portfolio. Whether you’re tax-loss harvesting and wondering where to reinvest assets or unsure how to navigate fixed income allocations amid unpredictable Fed policy, we’ve identified three reasons why bonds (and active fixed income ETFs) appear compelling in the current environment.


Reason 1: The importance of diversification


Bonds are expected to return to providing diversification from equities, which will likely be beneficial if there’s a recession.

  • Expected rate hikes have largely been priced into the market based on the Fed’s consistent message to anticipate additional rate increases.
  • Core and core-plus bond funds’ diversification benefits appear to be normalizing, returning core bond funds to their traditional role of helping to cushion volatility in equity markets as they have over the past three recessions.
  • Furthermore, attractive bond yields provide a compelling opportunity set amid continued macroeconomic uncertainty.
  • Consider fortifying the core of portfolios with an active core or core-plus fixed income allocation, such as the Capital Group Core Plus Income ETF (CGCP).
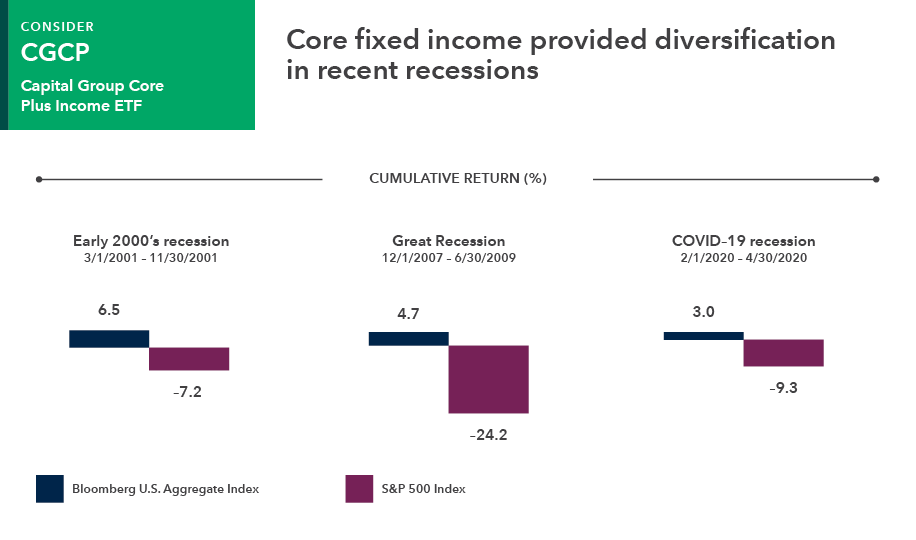
A headline above the bar graph says: “Core fixed income provided diversification in recent recessions.” It illustrates the diversification benefit core bonds provided during periods of equity market weakness by comparing the cumulative returns of the Bloomberg U.S. Aggregate Index with those of the S&P 500 Index during three recent recessions. During the recession in the early 2000’s (spanning 3/1/2001 to 11/30/2001), bonds (as represented by the Bloomberg U.S. Aggregate Index) had a cumulative return of 6.5% while equities (as represented by the S&P 500 Index) had a cumulative return of –7.2%. During the Great Recession, from 12/1/2007 to 6/30/2009, bonds returned 4.7% while equities returned –24.2%. During the COVID-19 recession, from 2/1/2020 to 4/30/2020, bonds returned 3.0% while equities returned –9.3%. To the left of the graph, there is a green box that says: Consider CGCP Capital Group Core Plus Income ETF.

Sources: Morningstar, Bloomberg Index Services Ltd. Recession periods defined by the National Bureau of Economic Research. Correlations calculated using daily returns. Returns shown are cumulative. Past results are not predictive of results in future periods.

Reason 2: Option to tax-loss harvest in bond funds


If you’re still holding fixed income funds purchased in early 2022 or before, there may be an opportunity to generate losses to offset gains elsewhere, if any, and lower tax liabilities. However, fixed income tax-loss harvesting opportunities may become scarcer if bond markets continue to recover and inflation pressures recede.


"When it comes to tax-loss harvesting, our active fixed income ETFs can be a compelling investment during the wash sale period as a way for investors to preserve their allocations and maintain exposure to a changing market while still booking losses."

Holly Framsted
Capital Group Director of ETFs

Capital Group active fixed income ETFs can serve as tax-loss harvesting swaps for many common fixed income allocations

Source: Morningstar Direct, all data as of 12/31/22. Yield to worst is the lowest yield that can be realized by either calling or putting on one of the available call/put dates, or holding a bond to maturity.

§Tax-equivalent yield as of 12/31/22. The taxable equivalent yield assumptions are based on a federal marginal tax rate of 37%, the top 2022 rate. In addition, we have applied the 3.8% Medicare rate.

Reason 3: Late-market cycle opportunities across fixed income sectors


The global economy appears to be in the late stages of a market cycle, possibly offering an opportune time to invest in fixed income securities — if you know where to look.

  • The bond market appears to be normalizing and may present an attractive entry point for investors as lower valuations present some compelling opportunities.
  • Higher yields in short-duration, high-quality bonds appear to present an opportunity to earn more income than cash without taking on a significant amount of risk.
  • Within municipal bond markets, solid credit fundamentals and high reserves suggest issuers are well positioned to weather a potential recession.
  • High-income areas of the fixed income market look appealing but it’s important to rely on research and be selective. In the current environment, it’s not necessary to take on a lot of risk to get attractive yields.

"CGSD, our short duration income ETF, has relatively low interest rate sensitivity and aims for income and capital preservation. In comparison to other short duration offerings that are income oriented, CGSD emphasizes higher quality as well as more diversity in the income-producing sectors reflected in the portfolio. We believe that may lead to less volatility over time while still delivering attractive income and returns relative to much of the yield-focused peer group."

Anmol Sinha
Investment Director for CGSD
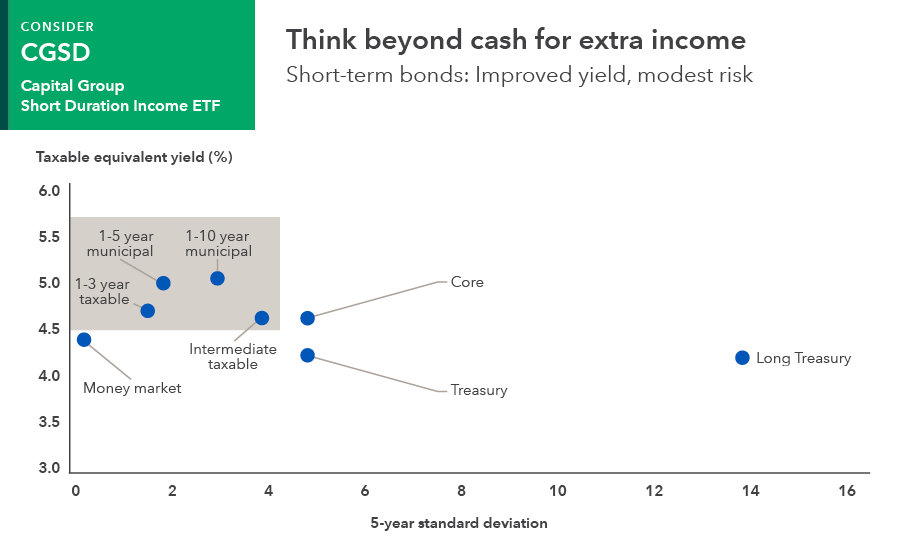
A headline above the graphic says: “Think beyond cash for extra income.” The subhead says: “Short-term bonds: Improved yield, modest risk.” The y-axis shows the taxable equivalent yield, and the x-axis shows the 5-year standard deviation for eight different types of fixed income securities. Money market securities, as represented by the Morningstar Primate Money Market Category average, have a 5-year standard deviation of 0.29% and a taxable equivalent yield of 4.39%. 1-3 year taxable bonds, as represented by the Bloomberg U.S. Aggregate 1-3 Year Index, have a 5-year standard deviation of 1.54% and a taxable equivalent yield of 4.72%. 1-5 year municipal bonds, as represented by the Bloomberg Municipal Short 1-5 Year Index, have a 5-year standard deviation of 2.32% and a taxable equivalent yield of 5%. 1-10 year municipal bonds, as represented by the Bloomberg Municipal Short-Intermediate 1-10 Years Index, have a 5-year standard deviation of 3.38% and a taxable equivalent yield of 5.03%. Intermediate taxable bonds, as represented by the Bloomberg U.S. Intermediate Aggregate Index, have a 5-year standard deviation of 3.78% and a taxable equivalent yield of 4.63%. Core bonds, as represented by the Bloomberg U.S. Aggregate Index, have a 5-year standard deviation of 5.09% and a taxable equivalent yield of 4.68%. Treasuries, as represented by the Bloomberg U.S. Treasury Index, have a 5-year standard deviation of 5.07% and a taxable equivalent yield of 4.18%. Long Treasuries, as represented by the Bloomberg U.S. Long Treasury Index, have a 5-year standard deviation of 13.58% and a taxable equivalent yield of 4.08%. At the top of the graph, there’s a green box that says: Consider CGSD Capital Group Short Duration Income ETF.

As of December 30, 2022. Source: Bloomberg Index Services, Ltd., Morningstar. Money Market: Morningstar Prime Money Market Category average. 1-3 year taxable: Bloomberg U.S. Aggregate 1-3 Year Index, Intermediate taxable: Bloomberg U.S. Aggregate Intermediate Index, 1-5 year municipal: Bloomberg Municipal Short 1-5 year Index, 1-10 year municipal: Bloomberg Municipal Short-Intermediate 1-10 year Index, Core: Bloomberg U.S. Aggregate Index, Treasury: Bloomberg U.S. Treasury Index, Long Treasury: Bloomberg U.S. Long Treasury Index. Yields for indexes are yield to worst. Money market yield is 7-day SEC yield. Taxable-equivalent-rate assumptions are based on a federal marginal tax rate of 37%, the top 2022 rate. In addition, we have applied the 3.8% Medicare tax. Standard deviation is a common measure of absolute volatility that tells how returns over time have varied from the mean. A lower number signifies lower volatility. Past results are not predictive of results in future periods. The indexes are unmanaged and therefore, have no expenses. Investors cannot invest directly in an index.

"CGMU has the flexibility to act on what managers believe could be potential weaknesses in municipal credit spreads that may pop up to create attractive valuations."

Greg Ortman
Investment Director for CGMU
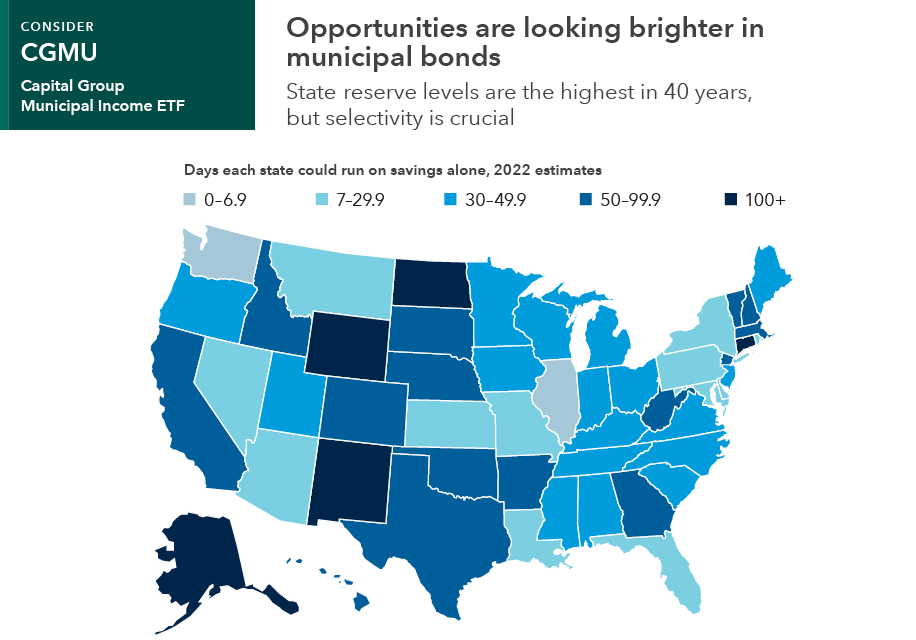
The headline above the graphic says: “Opportunities are looking brighter in municipal bonds.” The subhead says: “State reserve levels are the highest in 40 years, but selectivity is crucial.” The graphic shows a map of the U.S. with each state color coded and labeled to show how many days the state could run on savings alone, based on 2022 estimates. A grayish-blue color represents 0–6.9 days, a light blue color represents 7–29.9 days, a mid-blue color represents 30–49.9 days, a navy blue color represents 50–99.9 days and the darkest blue color represents 100-plus days. The states in grayish blue are Washington and Illinois. The states in light blue are Nevada, Arizona, Montana, Kansas, Louisiana, Missouri, Florida, Maryland/D.C., Delaware, Pennsylvania, New York and Rhode Island. The mid-blue states are Oregon, Utah, Minnesota, Iowa, Wisconsin, Mississippi, Alabama, Tennessee, Kentucky, Indiana, Ohio, Michigan, South Carolina, North Carolina, Virginia, New Jersey and Maine. The states in navy blue are California, Idaho, Colorado, Nebraska, South Dakota, Texas, Oklahoma, Arkansas, Georgia, West Virginia, Massachusetts, New Hampshire, Vermont and Hawaii. The states in the darkest blue color are Alaska, New Mexico, Wyoming, North Dakota and Connecticut. To the right of the map, there is a dark green box that says: Consider CGMU Capital Group Municipal Income ETF.

Sources: Capital Group, Pew Charitable Trusts; National Association of State Budget Officers. Data is reported by each state for its fiscal year, which ends June 30 in all but four states: New York (March 31), Texas (August 31), Alabama (September 30) and Michigan (September 30).

In the current bond environment, it’s important to be selective about sources of income, which is where an experienced active manager can help, particularly with a multi-sector income strategy. Such strategies allow flexibility across sectors to help focus on areas that have potential to offer the most added value.


"When pursuing higher income, you want a diversified fund for two reasons: first, diversification offers the potential for better risk management and second, no single income sector always comes out on top — therefore flexibility is a key to uncovering the best relative value across sectors and maximizing longer term risk-adjusted results. Given the complexities of credit markets, you'll want an active manager to be pulling those risk levels for you."

Harry Phinney
Investment Director for CGMS
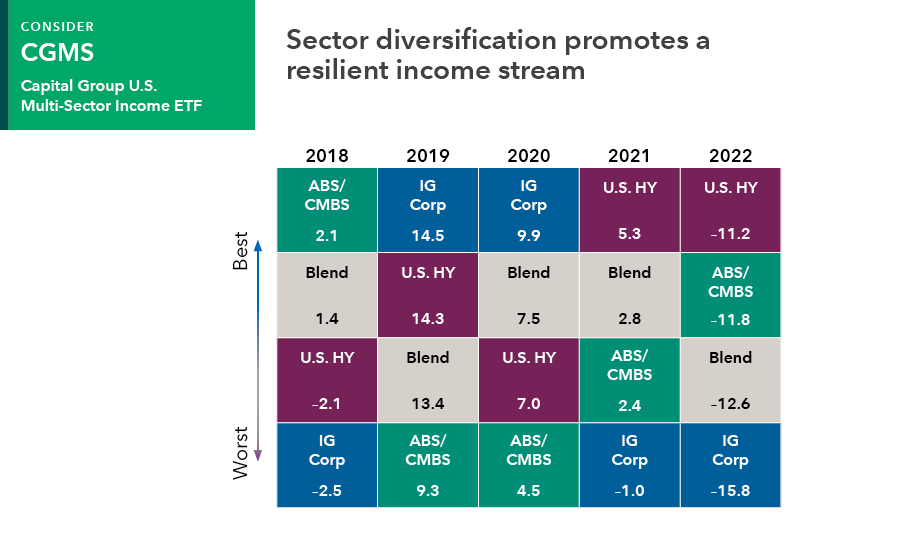
The headline above the graphic says: “Sector diversification promotes a resilient income stream.” The graphic shows the yield to worst of four different types of bonds from 2018 through 2022, listed in order of best to worst. The four types of bonds are investment-grade corporates (abbreviated as IG Corp, represented by the Bloomberg U.S. Corporate Investment Grade Index and shown in navy blue), U.S. high-yield (abbreviated U.S. HY, represented by the Bloomberg U.S. Corporate High Yield 2% Issuer Capped Index and shown in purple), asset-backed and commercial mortgage-backed securities (abbreviated ABS/CMBS, represented by 80% Bloomberg CMBS Ex AAA Index/20% Bloomberg ABS Ex AAA Index and shown in green) and a blend (represented by a Multi-Sector Income Fund Custom Blended Index and shown in gray). In 2018, the best was ABS/CMBS at 2.1, then Blend (1.4), then U.S. HY (–2.1) and the worst was IG Corp at –2.5 for a best-to-worst spread of 4.6. In 2019, IG Corp was the best at 14.5, then U.S. HY (14.3), then Blend (13.4) and ABS/CMBS had the worst at 9.3 for a best-to-worst spread of 5.2. In 2020, IG Corp had the best yield at 9.9, then Blend (7.5), then U.S. HY (7.0) and the worst was ABS/CMBS at 4.5 for a best-to-worst spread of 5.4. In 2021, U.S. HY had the best yield at 5.3, then Blend (2.8), then ABS/CMBS (2.4) and the worst was IG Corp for a best-to-worst spread of 6.3. In 2022, U.S. HY had the best yield at –11.2, then ABS/CMBS (–11.8), then Blend (–12.6) and the worst was IG Corp at –15.8 for a best-to-worst spread of 4.6. The average best-to-worst spread from 2008 to 2022 was 12.3. A separate grid to the right of the chart lists the 10-year annualized return for U.S. HY (4.0), Blend (3.1), ABS/CMBS (2.0) and IG Corp (2.0). Next it lists the 10-year standard deviation (annualized) for U.S. HY (7.4), IG Corp (6.2), Blend (5.9) and ABS/CMBS (4.9). In the last column it shows the 10-year Sharpe ratio (annualized) for U.S. HY (0.5), Blend (0.4), ABS/CMBS (0.3) and IG Corp (0.2). To the right of the chart, there’s a green box that says: Consider CGMS Capital Group U.S. Multi-Sector Income ETF.

Data as of December 31, 2022. U.S. HY represents Bloomberg U.S. Corporate High Yield 2% Issuer Capped Index; IG Corp represents Bloomberg U.S. Corporate Investment Grade Index; ABS/CMBS represents 80% Bloomberg CMBS Ex AAA Index/20%Bloomberg ABS Ex AAA Index. Blend is Multi-Sector Income Fund Custom Blended Index comprises: 45% Bloomberg U.S. Corporate High Yield 2% Issuer Capped Index, 30% Bloomberg U.S. Corporate Investment Grade Index, 15% J.P. Morgan EMBI Global Diversified Index, 8% Bloomberg CMBS Ex AAA Index, 2% Bloomberg Ex AAA Index. Past results are not predictive of results in future periods. The indexes are unmanaged and therefore, have no expenses. Investors cannot invest directly in an index.

Active fixed income management may hold added appeal in an uncertain environment


The current fixed income environment presents opportunities that may help position portfolios for the year ahead. However, if you hold passive fixed income strategies, it’s important to remember that you will need to carefully monitor interest rate risk and duration across those funds. For support in these areas, consider investing in active fixed income funds, particularly active fixed income ETFs, which may offer additional liquidity, transparency and tax benefits. Our portfolio construction team has experience identifying opportunities to simplify fixed income allocations, potentially lowering clients’ fees and allowing you to spend more time supporting your clients and growing your business. To learn more, request a consultation today.
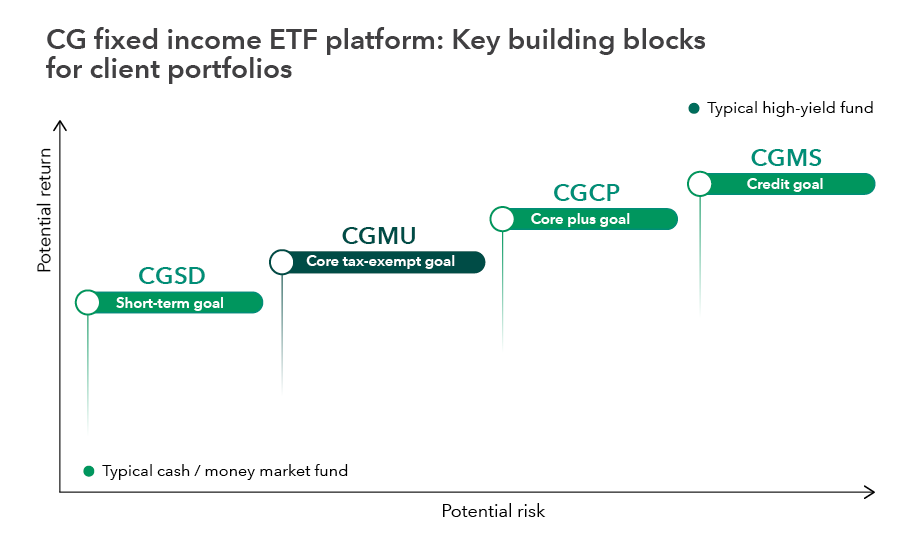

The headline above the graphic says: “CG fixed income ETF platform: Key building blocks for client portfolios.” It shows Capital Group’s four fixed income ETFs plotted on a graph with each fund move slightly further along the potential risk spectrum (x-axis) and slightly higher on the potential return spectrum (y-axis). There is a green dot representing a typical cash/money market fund at a point of low risk and low return. About midway up the potential return spectrum (but roughly in line with the typical cash/money market fund for risk) is CGSD, which has a short-term goal. Next is CGMU, which is an intermediate core municipal bond strategy and has a core tax-exempt goal. Next is CGCP, which has a core plus goal. The next fund shown is CGMS, which has a multi-sector credit goal. There is a green dot at the highest (most potential return) and furthest (most potential risk) point representing a typical high-yield fund.

The typical cash/money market fund and the typical high-yield fund are for illustrative purposes only and are not plotted to an index. 

*Interest rate risk is the risk of a decline in the value of fixed income assets due to a change in interest rates.

The Internal Revenue Service's wash-sale rule regulates the timing around how quickly a substantially identical security can be purchased after the underperforming asset was sold to realize a tax benefit from tax-loss harvesting.


The S&P 500 Index is a market capitalization-weighted index based on the results of approximately 500 widely held common stocks.

Contact us to learn more

For more information about Capital Group’s ETFs, call our RIA support line at (800) 421-5450 or contact your relationship manager or specialist directly. 

Investments are not FDIC-insured, nor are they deposits of or guaranteed by a bank or any other entity, so they may lose value.
Investors should carefully consider investment objectives, risks, charges and expenses. This and other important information is contained in the fund prospectuses and summary prospectuses, which can be obtained from a financial professional and should be read carefully before investing.
Capital Group exchange-traded funds (ETFs) are actively managed and do not seek to replicate a specific index. ETF shares are bought and sold through an exchange at the then current market price, not net asset value (NAV), and are not individually redeemed from the fund. Shares may trade at a premium or discount to their NAV when traded on an exchange. Brokerage commissions will reduce returns. There can be no guarantee that an active market for ETFs will develop or be maintained, or that the ETF's listing will continue or remain unchanged.
Investments in mortgage-related securities involve additional risks, such as prepayment risk.
The use of derivatives involves a variety of risks, which may be different from, or greater than, the risks associated with investing in traditional securities, such as stocks and bonds.
Lower rated bonds are subject to greater fluctuations in value and risk of loss of income and principal than higher rated bonds.
The return of principal for bond portfolios and for portfolios with significant underlying bond holdings is not guaranteed. Investments are subject to the same interest rate, inflation and credit risks associated with the underlying bond holdings.
Income from municipal bonds may be subject to state or local income taxes and/or the federal alternative minimum tax. Certain other income, as well as capital gain distributions, may be taxable. 
Investing outside the United States involves risks, such as currency fluctuations, periods of illiquidity and price volatility. These risks may be heightened in connection with investments in developing countries.
Nondiversified funds have the ability to invest a larger percentage of assets in the securities of a smaller number of issuers than a diversified fund. As a result, poor results by a single issuer could adversely affect fund results more than if the fund invested in a larger number of issuers. See the applicable prospectus for details.
This material does not constitute legal or tax advice. Investors should consult with their legal or tax advisors.
There have been periods when the results lagged the index(es) and/or average(s). The indexes are unmanaged and, therefore, have no expenses. Investors cannot invest directly in an index.
Source: Bloomberg Index Services Limited. BLOOMBERG® is a trademark and service mark of Bloomberg Finance L.P. and its affiliates (collectively "Bloomberg"). Bloomberg or Bloomberg's licensors own all proprietary rights in the Bloomberg Indices. Neither Bloomberg nor Bloomberg's licensors approves or endorses this material, or guarantees the accuracy or completeness of any information herein, or makes any warranty, express or implied, as to the results to be obtained therefrom and, to the maximum extent allowed by law, neither shall have any liability or responsibility for injury or damages arising in connection therewith.
Each S&P Index ("Index") shown is a product of S&P Dow Jones Indices LLC and/or its affiliates and has been licensed for use by Capital Group. Copyright © 2024 S&P Dow Jones Indices LLC, a division of S&P Global, and/or its affiliates. All rights reserved. Redistribution or reproduction in whole or in part is prohibited without written permission of S&P Dow Jones Indices LLC.
Statements attributed to an individual represent the opinions of that individual as of the date published and do not necessarily reflect the opinions of Capital Group or its affiliates. This information is intended to highlight issues and should not be considered advice, an endorsement or a recommendation.
All Capital Group trademarks mentioned are owned by The Capital Group Companies, Inc., an affiliated company or fund. All other company and product names mentioned are the property of their respective companies.
  1. Expense ratios are as of each fund's prospectus/characteristics statement available at the time of publication.
Use of this website is intended for U.S. residents only.
Capital Client Group, Inc.
This content, developed by Capital Group, home of American Funds, should not be used as a primary basis for investment decisions and is not intended to serve as impartial investment or fiduciary advice.
© 2024 Morningstar, Inc. All Rights Reserved. Some of the information contained herein: (1) is proprietary to Morningstar and/or its content providers; (2) may not be copied or distributed; and (3) is not warranted to be accurate, complete or timely. Neither Morningstar, its content providers nor Capital Group are responsible for any damages or losses arising from any use of this information. Past performance is no guarantee of future results. Information is calculated by Morningstar. Due to differing calculation methods, the figures shown here may differ from those calculated by Capital Group.