Emerging Markets
- Emerging markets fixed income securities range across the quality spectrum and feature yields comparable to U.S. high-yield debt, but with lower correlation to U.S. stocks.
- Capital Group relies on longstanding emerging markets experience and global research depth of fixed income investment professionals to find opportunities related to mispriced assets, currency exposure and yield-curve positioning.
- Adding emerging markets bonds in client portfolios can increase yields and enhance overall diversification, in turn lowering overall risk.
The emerging markets debt market offers an often-overlooked opportunity for investors seeking relatively high yields and less correlation with U.S. stocks, a key reason to hold bonds in the first place.
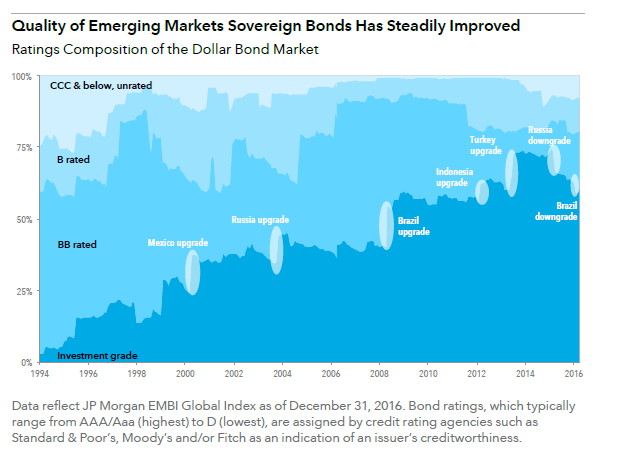
Emerging markets economies are rapidly increasing their share of global growth and are expected to contribute half the global GDP by 2021.1 As these nations’ economies mature and grow, so do their debt markets. The investable emerging markets debt market has more than tripled since 2000 to around $6 trillion.2About half the emerging markets debt universe is investment grade.3

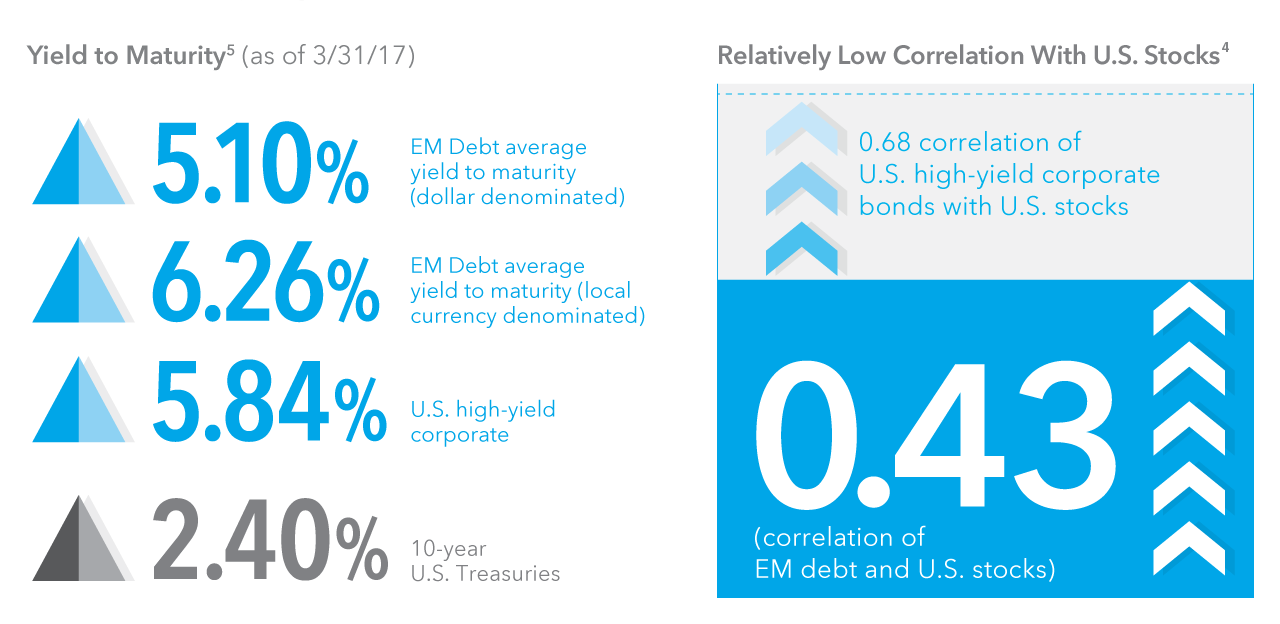
Fueled by these favorable trends, emerging markets debt has developed into a diverse market, creating the possibility of attractive risk-adjusted yields outside traditional asset-class models. Emerging markets bonds offer an income benefit, as their yields are comparable with U.S. high-yield corporate bonds (see chart below). But unlike U.S. high-yield corporate bonds, which are highly correlated with U.S. stocks at 0.68, emerging markets dollar-denominated bonds have a lower correlation of 0.43.4 Investing outside the United States can involve risks, such as currency fluctuations, periods of illiquidity and price volatility. These risks may be heightened in connection with investments in developing countries.

Data reflect JP Morgan EMBI Global Index as of December 31, 2016. Bond ratings, which typically range from AAA/Aaa (highest) to D (lowest), are assigned by credit rating agencies such as Standard & Poor’s, Moody’s and/or Fitch as an indication of an issuer’s creditworthiness.
Investment Results (%) (As of 6/30/2017)
| 1 Year | Lifetime (Fund Inception 04/22/2016) | Expense Ratio | Annualized 30-Day SEC Yield |
|
| American Funds Emerging Markets Bond Fund (F-3) |
8.31 | 9.23 | 0.98 | 6.49 |
Investment results assume all distributions are reinvested and reflect applicable fees and expenses. The expense ratio is as of the prospectus available at the time of publication. The expense ratios for Class F-3 shares are estimated. The investment adviser is currently reimbursing a portion of other expenses for American Funds Emerging Markets Bond Fund. Investment results reflect the reimbursements, without which the results would have been lower and the expense ratios would have been higher. This reimbursement will be in effect through at least April 7, 2018. The adviser may elect at its discretion to extend, modify or terminate the reimbursement at that time. Please see the fund’s most recent prospectus for details.
The SEC yield reflects the rate at which the fund is earning income on its current portfolio of securities. Class F-3 shares were first offered on January 27, 2017.
Figures shown are past results for Class F-3 shares with all distributions reinvested and are not predictive of results in future periods. Current and future results may be lower or higher than those shown. Share prices and returns will vary, so investors may lose money. Investing for short periods makes losses more likely. For current information and month-end results, visit americanfunds.com.
Class F-3 share results prior to the date of first sale are hypothetical based on Class A share results without a sales charge, adjusted for typical estimated expenses. Please see americanfunds.com for more information on specific expense adjustments and the actual dates of first sale.
If used after September 30, 2017, this publication must be accompanied by a current American Funds quarterly statistical update.
1 Source: International Monetary Fund.
2 According to data from Bank of America Merrill Lynch, the size of the investable emerging markets bond universe was about $5.9 trillion at year-end 2015.
3 Source: J.P. Morgan EMBI Global Index as of March 31, 2016. The market indexes are unmanaged and, therefore, have no expenses. Investors cannot invest directly in an index. This report, and any product, index or fund referred to herein, is not sponsored, endorsed or promoted in any way by J.P. Morgan or any of its affiliates who provide no warranties whatsoever, express or implied, and shall have no liability to any prospective investor, in connection with this report.
4 Correlation for high-yield corporate bonds based on Bloomberg Barclays High Yield Corporate Total Return Index and for emerging markets debt based on J.P. Morgan EMBI Global Diversified Index. Correlations measured against the Standard & Poor’s 500 Index for the period between 4/1/2014 and 3/31/2017. Information has been obtained from sources believed to be reliable but J.P. Morgan does not warrant its completeness or accuracy. The Index is used with permission. The Index may not be copied, used, or distributed without J.P. Morgan’s prior written approval. Copyright 2017, J.P. Morgan Chase & Co. All rights reserved. Bloomberg® is a trademark of Bloomberg Finance L.P. (collectively with its affiliates, “Bloomberg”). Barclays® is a trademark of Barclays Bank Plc (collectively with its affiliates, “Barclays”), used under license. Neither Bloomberg nor Barclays approves or endorses this material, guarantees the accuracy or completeness of any information herein and, to the maximum extent allowed by law, neither shall have any liability or responsibility for injury or damages arising in connection therewith. The S&P 500 Index is a product of S&P Dow Jones Indices LLC and/or its affiliates and has been licensed for use by Capital Group. Copyright © 2017 S&P Dow Jones Indices LLC, a division of S&P Global, and/or its affiliates. All rights reserved. Redistribution or reproduction in whole or in part are prohibited without written permission of S&P Dow Jones Indices LLC.
5Yield to Maturity for emerging markets and U.S. high-yield corporate bonds are based on the J.P. Morgan EMBI Global Diversified Index and Bloomberg High Yield Corporate Total Return Index, respectively. Sources: Bloomberg Index Services Ltd., Morningstar. © 2017 Morningstar. All Rights Reserved. The information contained herein: (1) is proprietary to Morningstar and/or its content providers; (2) may not be copied or distributed; and (3) is not warranted to be accurate, complete or timely. Neither Morningstar nor its content providers are responsible for any damages or losses arising from any use of this information. Past performance is no guarantee of future results.
Use of this website is intended for U.S. residents only.