Market Volatility
Market Volatility
The U.S. economy’s resilience continues to defy doubters. Most investors, though, agree that the economy is late in the cycle and it’s a good idea to prepare for a slowdown. Some common approaches to prepare for volatility may have shortcomings. There are alternatives to consider.
Many investors seek to upgrade the core of their portfolios in two ways:
While these techniques for preparing portfolios are commonly deployed, each of these common strategies may have hidden shortcomings.
Equity instinct #1: A value screen can fall short in three ways.
1. Dividend-paying stocks are often left out.
Don’t assume value brings dividends. About 22% of stocks in the Russell 1000 Value Index had an average dividend yield of 0% or close to zero during 2018.1 This no-dividend group of stocks in the index averaged 3% larger average drawdown (the peak-to-trough decline over a specific time period) and 8% larger downside capture ratio than the overall index.
2. Quality companies aren’t a focus.
Lower-quality and distressed companies are often part of the index. In fact, 40% of the rated companies in the Russell 1000 Value Index were BBB- or lower, as of December 31, 2018.2 Shares of these companies had worse average drawdown (–21% versus –18% for all rated stocks) and worse downside capture (125% vs. 116% for all rated stocks).
3. Volatility isn’t necessarily reduced.
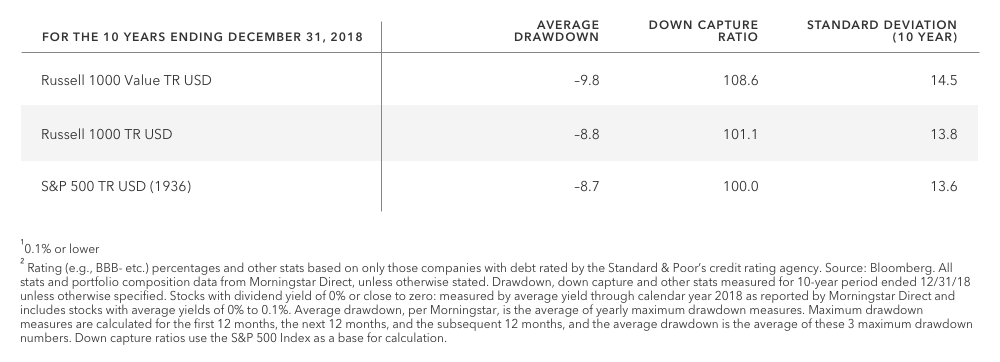
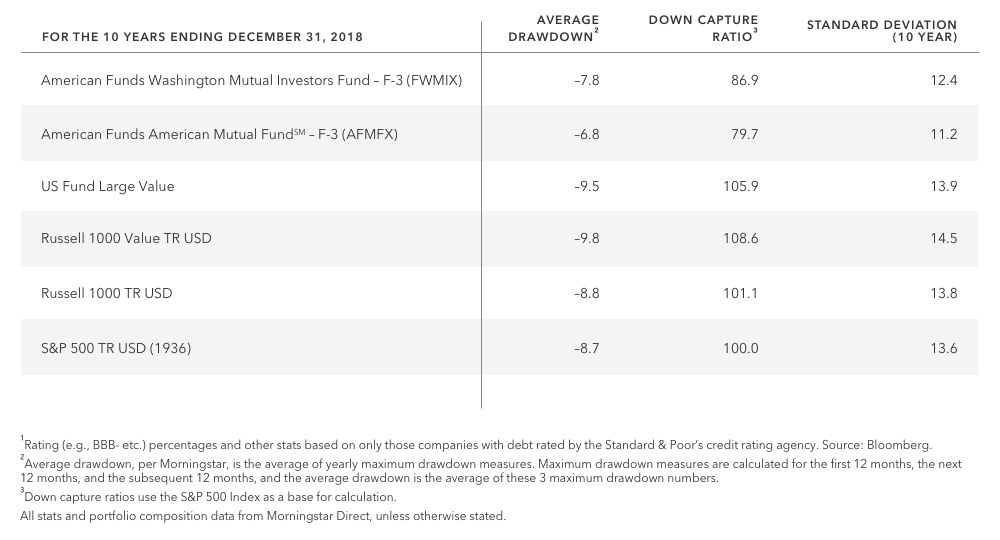
Risk is commonly measured by standard deviation, downside capture and average drawdown. All three of these measures for the Russell 1000 Value Index (using 10-year trailing figures) were essentially equal to or higher than for the broader market (as represented by the S&P 500), as of December 31, 2018. This might surprise some value investors thinking they are offsetting risk from their growth stocks.
Do your bonds really have you covered?
While these techniques for preparing portfolios are commonly deployed, each of these common strategies have hidden shortcomings.
Equity instinct #2: Simply adding a basket of dividend stocks alone may not be the best solution.
1. Quality companies aren’t a focus.
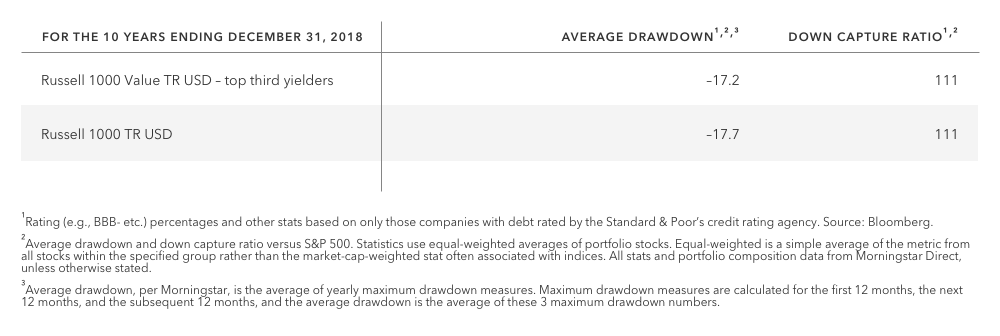
Lower-quality or even distressed companies are included in the broader pools of dividend payers. About 30% of the top third (highest yielding) stocks in the Russell 1000 Index were rated BBB– or lower, as of December 31, 2018. These high yielding, BBB–1 and lower stocks had an average 10-year S&P 500 down capture ratio of 136%. Shares of these stocks also had an average debt-to-equity ratio (a measure of a company's leverage calculated by comparing its total liabilities to its shareholder equity) of 2.4, meaning they were almost two-and-a-half-times levered.
2. Some of the highest-yielding stocks may not provide a volatility buffer.
Common measures of risk, standard deviation, downside capture and average drawdown of high-yielding stock for high-dividend-paying stocks were essentially at or above the broader market (as represented by the S&P 500), as of December 31, 2018.
A new value screen to consider:
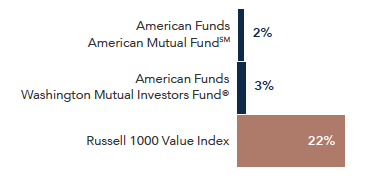
1. A true commitment to dividend payers
% of stock portfolio in nonpayers (as of 12/31/18)
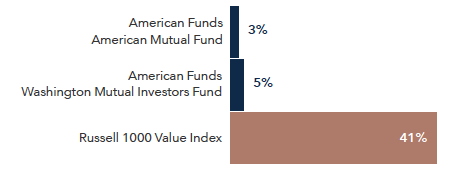
2. A focus on quality
% of stock portfolio rated BBB– or lower
(by S&P based on company’s debt, as of 12/31/18)1
All stats and portfolio composition data from Morningstar Direct, unless otherwise stated.
3. Two of our growth and income strategies have provided a smoother ride for investors.
Equity summary
- Late-cycle caution is warranted, but traditional approaches to reduce risk may have shortcomings.
- Deliberate security selection with a value tilt can limit downside capture, while positioning for a rebound.
- Dividends matter. But so do the quality and the sustainability of them.
How American Funds can help you upgrade your portfolio’s equity core
Strategies
Multi-asset solutions
Portfolio consultation
Our experienced portfolio specialists can uncover opportunities and identify potential risks to enhance your portfolios and help you improve your clients’ outcomes. Their comprehensive process employs rigorous objective-based analysis, strategic evaluation and risk allocation.
To schedule a portfolio consultation, call 1-800-421-9889.
More in this series: Upgrade your core portfolio
Do your bonds really have you covered?
Annualized standard deviation (based on monthly returns) is a common measure of absolute volatility that tells how returns over time have varied from the mean. A lower number signifies lower volatility.
Capture ratio reflects the annualized product of fund versus index returns for all months in which the index had a positive return (upside capture) or negative return (downside capture).
The Standard & Poor’s 500 Composite Index is a market capitalization-weighted index based on the results of approximately 500 widely held common stocks. The S&P 500 is a product of S&P Dow Jones Indices LLC and/or its affiliates and has been licensed for use by Capital Group. Copyright © 2019 S&P Dow Jones Indices LLC, a division of S&P Global, and/or its affiliates. All rights reserved. Redistribution or reproduction in whole or in part are prohibited without written permission of S&P Dow Jones Indices LLC.
Bloomberg® is a trademark of Bloomberg Finance L.P. (collectively with its affiliates, “Bloomberg”). Barclays® is a trademark of Barclays Bank Plc (collectively with its affiliates, “Barclays”), used under license. Neither Bloomberg nor Barclays approves or endorses this material, guarantees the accuracy or completeness of any information herein and, to the maximum extent allowed by law, neither shall have any liability or responsibility for injury or damages arising in connection therewith.
Use of this website is intended for U.S. residents only.

