Capital Group Funds (Canada)
- Summary
- Portfolio managers
- Distributions
Investment Objective
The fund has two primary investment objectives. It seeks to provide (1) a level of current income that exceeds the average yield on U.S. stocks generally and (2) a growing stream of income over the years (in both cases, measured in U.S. dollars). The fund's secondary objective is to provide growth of capital. The fund invests primarily in a broad range of income-producing securities, including common stocks and bonds.
Fund Description
A global focus on income
Emphasis on above-average and growing income from a broad range of income-producing securities.
Emphasis on above-average and growing income from a broad range of income-producing securities.
The monthly distribution series can help provide investors with a sustainable cash flow, tax efficiency and growth potential.

Returns
Growth of $10,000 since inception (Series F)
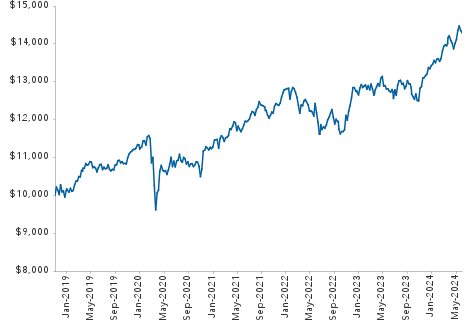
Returns include reinvestment of all distributions and do not reflect the effect of a sales charge. Past returns are not predictive of future returns.
| Returns (%) | Series F | Series F4 | |
| 1 month | 2.25 | 2.25 | |
| YTD | 16.20 | 16.20 | |
| 1 year* | 16.45 | 16.45 | |
| 3 years* | 13.22 | 13.21 | |
| 5 years* | 10.63 | 10.62 | |
| Lifetime* | 9.10 | 10.61 | |
| Lifetime (cumulative) | 85.30 | 65.63 | |
| 2024 | 18.87 | 18.86 | |
| 2023 | 6.06 | 6.04 | |
| 2022 | -1.14 | -1.15 | |
| 2021 | 13.48 | 13.48 |
*Annualized compound returns.
Portfolio information
| Fund assets ($mil) combined series | $529.3 | |
| Dividend yield (equity)1 | 3.03% | |
| Yield to worst (bonds)2 | 4.33% | |
| Companies / issuers | 493 | |
| Portfolio turnover (2024) | 63% | |
| Trading expense ratio3 | 0.06% | |
Sector diversification
| Equity | 77.2% |
| Financials | 15.1% |
| Information Technology | 11.3% |
| Health Care | 8.9% |
| Industrials | 8.6% |
| Consumer Staples | 8.2% |
| Utilities | 5.9% |
| Consumer Discretionary | 5.0% |
| Energy | 4.5% |
| Communication Services | 3.6% |
| Materials | 3.4% |
| Real Estate | 2.7% |
| Bonds | 16.7% |
| Government | 6.4% |
| Mortgage backed | 4.9% |
| Corporate | 4.8% |
| Asset backed | 0.6% |
| Cash and cash equivalents & other assets less liabilities |
6.1% |
| Total portfolio | 100.0% |
Portfolio characteristics
| Series F | Series F4 | |
| FundSERV | CIF 123 | CIF 8123 |
| MER4 | 0.80% | 0.80% |
| Fund inception | Oct 31, 2018 | Nov 30, 2020 |
| Minimum initial investment | $500 | $5,000 |
| Income distributions paid | Mar, Jun, Sep, Dec | December |
| Return of capital paid5 | — | Monthly |
| Capital gains paid | December | December |
| 12-month distribution rate6 | 2.4% | — |
| Trade settlement | T+17 | T+17 |
Portfolio managers
| Years with Capital / Years in profession | |
| Aline Avzaradel | 20 / 23 |
| Alfonso Barroso | 30 / 31 |
| Grant Cambridge | 28 / 28 |
| Charles Ellwein | 19 / 33 |
| David Hoag | 33 / 37 |
| Saurav Jain | 17 / 17 |
| Winnie Kwan | 25 / 30 |
| Jim Lovelace | 43 / 43 |
| Fergus MacDonald | 21 / 32 |
| Caroline Randall | 19 / 27 |
| Will Robbins | 30 / 33 |
| Steve Watson | 35 / 37 |
| Brian Wong | 10 / 17 |
Top equity holdings
| % of Portfolio | |
| Broadcom | 4.9 |
| TSMC | 2.3 |
| Philip Morris International | 2.3 |
| British American Tobacco | 2.0 |
| Rtx Corp | 1.9 |
| AbbVie | 1.5 |
| JPMorgan Chase | 1.5 |
| Microsoft | 1.4 |
| Amgen | 1.1 |
| AstraZeneca | 1.1 |
| Total top equity holdings | 20.0 |
Quarterly holdings (PDF)
Top fixed-income issuers
| % of Portfolio | Yield % | |
| U.S. Treasury | 6.4 | 3.8 |
| Fannie Mae | 2.1 | 4.6 |
| Federal Home Loan Mortgage | 1.4 | 4.7 |
| Ginnie Mae II | 0.3 | 4.8 |
| UMBS | 0.3 | 4.7 |
| Ford Motor | 0.2 | 5.1 |
| JPMorgan Chase | 0.2 | 4.6 |
| PG&E | 0.2 | 4.8 |
| Boeing | 0.1 | 4.7 |
| Edison International | 0.1 | 4.7 |
| Total top fixed-income issuers | 11.3 | |
Bond quality summary
| % of Bonds | |
| AAA/Aaa | 4.2 |
| AA/Aa | 65.6 |
| A | 9.6 |
| BBB/Baa | 11.6 |
| BB/Ba | 4.6 |
| B | 2.2 |
| CCC/Caa & below | 1.2 |
| Unrated | 1.1 |
| Investment grade | 91.0 |
| Below investment grade | 8.0 |
Geographic diversification
| Equity | Bonds | Portfolio | ||
| United States | 41.6% | 16.1% | 57.7% | |
| Europe ex-UK | 13.7% | 0.4% | 14.1% | |
| United Kingdom | 7.8% | 0.0% | 7.8% | |
| Emerging Markets | 5.0% | 0.1% | 5.1% | |
| Pacific Basin ex-Japan | 3.1% | 0.0% | 3.1% | |
| Canada | 3.0% | 0.1% | 3.1% | |
| Japan | 3.0% | 0.0% | 3.0% | |
| Cash and cash equivalents & other assets less liabilities |
6.1% | |||
| Total portfolio | 100.0% | |||
| 1 | Reflects dividend yield for the equity portion of the portfolio. Income generated by portfolio securities, before expenses; does not reflect unitholder distributions. |
| 2 | Yield to worst reflects the lowest yield that can be realized by either calling or putting on one of the available call/put dates, or holding a bond to maturity. |
| 3 | As of June 30, 2025. |
| 4 |
Capital Group, at its discretion, currently waives some of its management fees or absorbs some expenses of certain Capital Group funds. Such waivers and absorptions may be terminated at any time, but can be expected to continue for certain portfolios until such time as such funds are of sufficient size to reasonably absorb all management fees and expenses incurred in their operations.
The management expense ratio for the portfolio is based on unaudited total expenses for the six-month period ended June 30, 2025, and is expressed as an annualized percentage of daily average net assets during the period. Actual MERs may vary. For the six-month period ended June 30, 2025, the total net asset value of the series was of sufficient size to reasonably absorb all management fees and expenses incurred in the operations of the fund attributable to this series, and therefore there were no waivers or absorptions during this period.
|
| 5 | Payable on Series T4 and F4 only. |
| 6 | Reflects the sum of income distributions over the trailing 12 months, divided by the sum of the previous month's ending NAV plus any capital gains distributed over the 12-month period. |
| 7 | Prior to May 27, 2024, the trade settlement cycle for Capital Group Funds (Canada) was trade date (T) + 2. |
| Not available to U.S. residents. | |
| Updated on a monthly basis. | |
| Commissions, trailing commissions, management fees and expenses all may be associated with investments in investment funds. Please read the prospectus before investing. The indicated rates of return are the historical annual compounded total returns including changes in unit value and reinvestment of all distributions and do not take into account sales, redemption, distribution or optional charges or income taxes payable by any unitholder that would have reduced returns. Investment funds are not guaranteed or covered by the Canada Deposit Insurance Corporation or by any other government deposit insurer. For investment funds other than money market funds, their values change frequently. For money market funds, there can be no assurances that the fund will be able to maintain its net asset value per security at a constant amount or that the full amount of your investment in the fund will be returned to you. Past performance may not be repeated. | |

Aline Avzaradel
Years at Capital: 20
Years in profession: 23
Based in San Francisco
Aline Avzaradel is an equity portfolio manager at Capital Group. As an equity analyst, she covers U.S. insurance companies. Earlier in her career at Capital, her coverage included the apparel industry, nonalcoholic beverages and packaged food companies. Prior to joining Capital, Aline was an investment banking analyst with Morgan Stanley in New York. She holds an MBA from Stanford Graduate School of Business and a bachelor’s degree in economics and mathematics from Barnard College graduating summa cum laude and Phi Beta Kappa.

Alfonso Barroso
Years at Capital: 30
Years in profession: 31
Based in London
Alfonso Barroso is an equity portfolio manager at Capital Group. Earlier in his career, as an equity investment analyst at Capital, Alfonso covered retail companies in Europe and Latin America, European real-estate and REITs, and European internet and telecommunication services. Alfonso began his career at Capital as a participant in The Associates Program, a two-year series of work assignments in various areas of the organization. He holds a bachelor's degree with honours in economics and Hispanic studies from Harvard University.

Grant Cambridge
Years at Capital: 28
Years in profession: 28
Based in Los Angeles
Grant L. Cambridge is an equity portfolio manager at Capital Group. Earlier in his career, as an equity investment analyst at Capital, he covered insurance, airlines, air freight, home builders, asset managers and software companies, as well as small- and midcap companies. Prior to joining Capital, he worked for BTM Capital, a subsidiary of the Bank of Tokyo-Mitsubishi in Boston. He holds an MBA from Harvard Business School, a master's degree from Suffolk University and a bachelor's degree from Bentley College.

Charles Ellwein
Years at Capital: 19
Years in profession: 33
Based in San Francisco
Charles E. Ellwein is an equity portfolio manager at Capital Group. As an equity investment analyst, he covers U.S. commercial & professional services and Canada as a generalist. Earlier in his career at Capital, he also covered U.S. Exchanges and global telecom equipment. Prior to joining Capital, he was a managing member at Farallon Capital Management in San Francisco responsible for investments in the technology and media sectors. He holds an MBA with honours from Stanford Graduate School of Business and a bachelor’s degree with honours in electrical engineering from Brown University.

David Hoag
Years at Capital: 33
Years in profession: 37
Based in Los Angeles
David A. Hoag is a fixed income portfolio manager at Capital Group. He also serves on the Fixed Income Management Committee. Earlier in his career, as a fixed income investment analyst at Capital, he covered municipal bonds. Prior to joining Capital, David worked as a municipal bond analyst for Van Kampen Merritt Investment Advisory Corp. in Lisle, Illinois. He holds an MBA in finance from the University of Chicago Booth School of Business and a bachelor's degree in economics and business from Wheaton College, Illinois.

Saurav Jain
Years at Capital: 17
Years in profession: 17
Based in London
Saurav Jain is an equity portfolio manager at Capital Group. Earlier in his career at Capital, as an equity investment analyst, he covered Indian consumer companies and was a small- and mid-cap generalist for India. He also covered European autos, retail and food companies and Singapore as a generalist. Prior to joining Capital, Saurav was a corporate strategy analyst with Kraft Foods Inc. in the United States and a consultant with The Monitor Group in India. He holds an MBA from the London Business School and a bachelor’s degree in economics from Delhi University, graduating with honours.

Winnie Kwan
Years at Capital: 25
Years in profession: 30
Based in Hong Kong
Winnie Kwan is an equity portfolio manager at Capital Group. Earlier in her career, as an equity investment analyst at Capital, she covered global exchanges, Asian utilities and small-cap companies. Prior to joining Capital, Winnie worked with Morgan Stanley in London, Hong Kong and Singapore. She holds both master's and bachelor's degrees in economics from Trinity College at the University of Cambridge. She also holds the Chartered Financial Analyst® designation.

Jim Lovelace
Years at Capital: 43
Years in profession: 43
Based in Los Angeles
James B. Lovelace is an equity portfolio manager at Capital Group. Earlier in his career, as an equity investment analyst at Capital, Jim covered beverages & tobacco, restaurants & lodging, household products and personal care companies. Jim began his career at Capital as a participant in The Associates Program, a two-year series of work assignments in various areas of the organization. He holds a bachelor's degree with honours in philosophy from Swarthmore College. He also holds the Chartered Financial Analyst® designation and is a member of the Los Angeles Society of Financial Analysts.

Fergus MacDonald
Years at Capital: 21
Years in profession: 32
Based in Los Angeles
Fergus N. MacDonald is a fixed income portfolio manager at Capital Group. He also serves on the Fixed Income Management Committee. Earlier in his career at Capital, he was a fixed income investment analyst covering mortgage-backed securities. Prior to joining Capital, he was a vice president at Goldman Sachs & Co. and an associate in the derivative products group at Morgan Stanley. Before that, Fergus was a consultant and actuary at Hewitt Bacon & Woodrow in London. He holds a graduate degree in applied mathematics and theoretical physics from Cambridge University and a bachelor's degree with first-class honours in mathematics from the Imperial College of Science Technology and Medicine.

Caroline Randall
Years at Capital: 19
Years in profession: 27
Based in London
Caroline Randall is a portfolio manager at Capital Group. She also serves on the Capital Group Management Committee. Earlier in her career at Capital, as an equity investment analyst, she covered European utilities and transportation companies. Prior to joining Capital, she was head of European utilities research at J.P. Morgan. Before that, she was an analyst with Schroder Securities and an associate in investment banking at Deutsche Bank. She holds both a master’s and bachelor’s degree in economics from the University of Cambridge.

Will Robbins
Years at Capital: 30
Years in profession: 33
Based in San Francisco
William L. Robbins is an equity portfolio manager at Capital Group. He also serves on the Portfolio Solutions Committee. Earlier in his career, as an equity investment analyst at Capital, Will covered small-capitalization companies, REITs and U.S. banks. Prior to joining Capital, he was a part of the investment team at Tiger Management Corp. in New York and a financial analyst with Morgan Stanley. Will holds an MBA from Harvard Business School and a bachelor’s degree from Harvard College, graduating magna cum laude. Will is based in San Francisco.

Steve Watson
Years at Capital: 35
Years in profession: 37
Based in Hong Kong
Steven T. Watson is an equity portfolio manager at Capital Group. Earlier in his career, as an equity investment analyst at Capital, he covered Asian property and transportation, as well as European transportation and utilities companies. Before joining Capital, Steve was a buy-side research analyst for Sanford C. Bernstein & Co. in New York. He holds an MBA in finance from New York University Graduate School of Business Administration, a master's degree in French studies from New York University Institute of French Studies and a bachelor's degree in French from the University of Massachusetts graduating cum laude. He also studied Mandarin Chinese at Wuhan University and the Shanghai Foreign Language Institute in China.

Brian Wong
Years at Capital: 10
Years in profession: 17
Based in Los Angeles
Brian Wong is a fixed income portfolio manager at Capital Group. As a fixed income investment analyst, he covers auto rentals, telecommunications, cruise lines, cable and satellite companies. Prior to joining Capital, Brian was an international research analyst in equities at Fidelity Management & Research in Hong Kong. Before that, he was a private equity associate at TPG Capital and an investment banking analyst at Goldman, Sachs & Co. He holds an MBA from Harvard Business School and a bachelor’s degree in economics from the Wharton School at the University of Pennsylvania graduating summa cum laude.
| Capital Group funds and Capital International Asset Management (Canada), Inc., are part of Capital Group, a global investment management firm originating in Los Angeles, California in 1931. Capital Group manages equity assets through three investment groups. These groups make investment and proxy voting decisions independently. Fixed-income investment professionals provide fixed-income research and investment management across the Capital organization; however, for securities with equity characteristics, they act solely on behalf of one of the three equity investment groups. |
| Commissions, trailing commissions, management fees and expenses all may be associated with investments in investment funds. Please read the prospectus before investing. Investment funds are not guaranteed or covered by the Canada Deposit Insurance Corporation or by any other government deposit insurer. For investment funds other than money market funds, their values change frequently. For money market funds, there can be no assurances that the fund will be able to maintain its net asset value per security at a constant amount or that the full amount of your investment in the fund will be returned to you. Past performance may not be repeated. |
Distributions
|
Historical Prices & Distributions
Select Dates
From:
To:
| Commissions, trailing commissions, management fees and expenses all may be associated with investments in investment funds. Please read the prospectus before investing. Investment funds are not guaranteed or covered by the Canada Deposit Insurance Corporation or by any other government deposit insurer. For investment funds other than money market funds, their values change frequently. For money market funds, there can be no assurances that the fund will be able to maintain its net asset value per security at a constant amount or that the full amount of your investment in the fund will be returned to you. Past performance may not be repeated. |