Global Equities
Categories
Chart in Focus
As exports grow, U.S. cements position as an energy superpower
 Talha Khan
April 17, 2024
The U.S. is cementing its position as an energy superpower amid expanding geopolitical tension and evolving oil production dynamics. With crude exports soaring to record highs, the U.S. is riding a wave of demand from its European allies while simultaneously capturing Asian market share. The OPEC+ members recently extended their oil production cuts, allowing the U.S. to secure a larger slice of the global market.
More U.S. oil is heading overseas
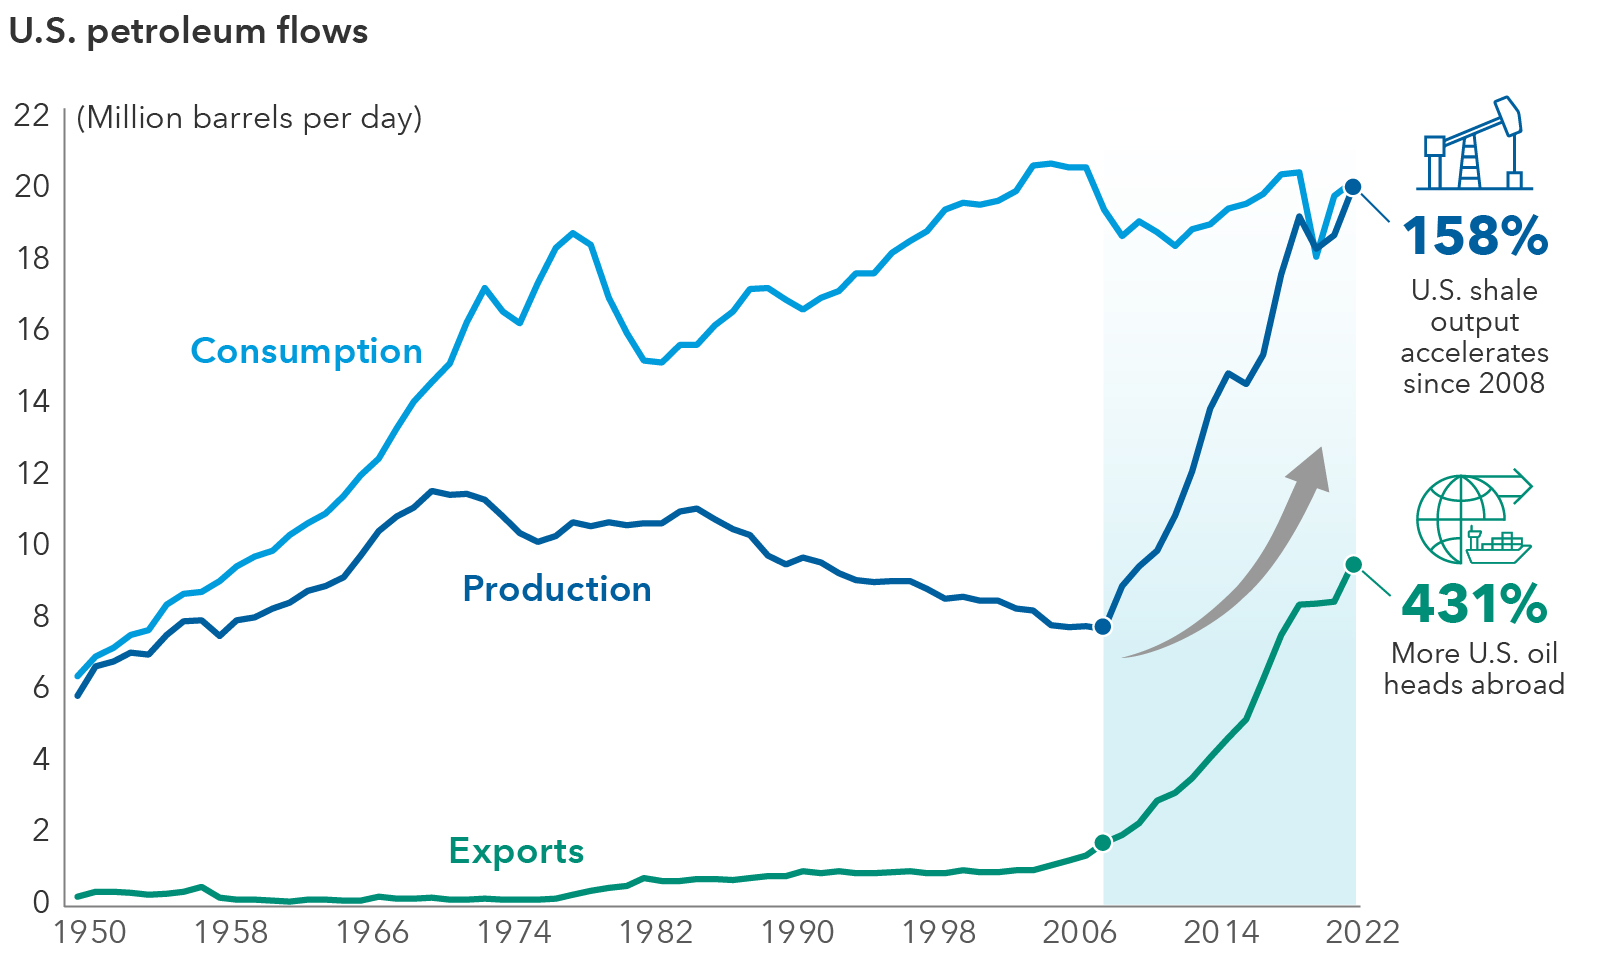
Source: U.S. Energy Information Administration, Monthly Energy Review, September 2023. Data from 1950 until 2022.
U.S. crude oil exports averaged 4.1 million barrels per day (b/d) in 2023, 13% more than the previous annual record set in 2022, according to the U.S. Energy Information Administration. In addition, crude exports reached an all-time high of 4.8 million b/d in March of this year.
Fallout from the Russia-Ukraine war has placed a spotlight on energy security, allowing the U.S. to fill a global void as European nations pivot from Russian petroleum products. American companies have ramped up domestic production to meet the growing demand, despite their commitment to fiscal discipline and focus on profitability. Meanwhile, shale output is hitting unprecedented levels, thanks to stronger drilling technologies that boost the productivity of oil wells.
Global markets initially shrugged off the breakout of the Israel-Hamas war, though any signs of the conflict broadening and/or extending could impact oil supply. Oil prices could remain elevated in such a scenario. Spot Brent crude oil has gained 17% year to date (as of April 15, 2024), while West Texas Intermediate is up 18%.
Moreover, Saudi Arabia has borne the brunt of OPEC+ production cuts, ceding market share to competitors such as the U.S., Canada and Iran. Saudi Arabia’s willingness to continue may flag as the kingdom could increase production in the latter half of 2024 in a bid to increase revenues and reclaim its market crown.
In U.S. dollar terms, the S&P 500 Energy Index has surged by almost 14% year to date (as of April 15, 2024), eclipsing the S&P 500 Index’s 6% increase, stemming from oil’s rise of over 20% from its December lows. Despite oil stocks being attractively valued at an average price-to-earnings multiple of 11.3, my colleague, investment analyst Craig Beacock, cautions that further gains could be limited in the near term after the recent strong move.
Still, the energy sector’s weighting of about 4% in the S&P 500 remains below historic levels, suggesting room for expansion as the sector makes gains in the medium term. This is partly why energy remains attractive in the long run. Signs of industry consolidation are occurring at major companies — Chevron announced a plan to buy Hess, and ExxonMobil expects to close a deal this quarter for shale producer Pioneer Natural Resources.
Learn more about
S&P 500 Index is a market-capitalization-weighted index based on the results of 500 widely held common stocks.
The S&P 500 Energy Index comprises those companies included in the S&P 500 that are classified as members of the GICS energy sector.
The Organization of the Petroleum Exporting Countries (OPEC) is a permanent intergovernmental organization with an objective to coordinate and unify petroleum policies among member countries. OPEC+ includes non-OPEC member countries that participate in the organization's voluntary supply cuts or policy objectives.
Shale oil is a type of unconventional oil found in shale formations that must be hydraulically fractured for extraction purposes.
Brent and West Texas Intermediate (WTI) are two leading oil benchmarks. Brent is the benchmark used for the light oil market in Europe, Africa, and the Middle East, while West Texas Intermediate is the benchmark for the U.S. light oil market and is sourced from U.S. oil fields.
Our latest insights
-
-
Demographics & Culture
-
-
Economic Indicators
-
U.S. Equities
RELATED INSIGHTS
-
Global Equities
-
Economic Indicators
-
Commissions, trailing commissions, management fees and expenses all may be associated with investments in investment funds. Please read the prospectus before investing. Investment funds are not guaranteed or covered by the Canada Deposit Insurance Corporation or by any other government deposit insurer. For investment funds other than money market funds, their values change frequently. For money market funds, there can be no assurances that the fund will be able to maintain its net asset value per security at a constant amount or that the full amount of your investment in the fund will be returned to you. Past performance may not be repeated.
Unless otherwise indicated, the investment professionals featured do not manage Capital Group‘s Canadian investment funds.
References to particular companies or securities, if any, are included for informational or illustrative purposes only and should not be considered as an endorsement by Capital Group. Views expressed regarding a particular company, security, industry or market sector should not be considered an indication of trading intent of any investment funds or current holdings of any investment funds. These views should not be considered as investment advice nor should they be considered a recommendation to buy or sell.
Statements attributed to an individual represent the opinions of that individual as of the date published and do not necessarily reflect the opinions of Capital Group or its affiliates. This information is intended to highlight issues and not be comprehensive or to provide advice. For informational purposes only; not intended to provide tax, legal or financial advice. Capital Group funds are available in Canada through registered dealers. For more information, please consult your financial and tax advisors for your individual situation.
Forward-looking statements are not guarantees of future performance, and actual events and results could differ materially from those expressed or implied in any forward-looking statements made herein. We encourage you to consider these and other factors carefully before making any investment decisions and we urge you to avoid placing undue reliance on forward-looking statements.
The S&P 500 Composite Index (“Index”) is a product of S&P Dow Jones Indices LLC and/or its affiliates and has been licensed for use by Capital Group. Copyright © 2025 S&P Dow Jones Indices LLC, a division of S&P Global, and/or its affiliates. All rights reserved. Redistribution or reproduction in whole or in part are prohibited without written permission of S&P Dow Jones Indices LLC.
FTSE source: London Stock Exchange Group plc and its group undertakings (collectively, the "LSE Group"). © LSE Group 2025. FTSE Russell is a trading name of certain of the LSE Group companies. "FTSE®" is a trade mark of the relevant LSE Group companies and is used by any other LSE Group company under licence. All rights in the FTSE Russell indices or data vest in the relevant LSE Group company which owns the index or the data. Neither LSE Group nor its licensors accept any liability for any errors or omissions in the indices or data and no party may rely on any indices or data contained in this communication. No further distribution of data from the LSE Group is permitted without the relevant LSE Group company's express written consent. The LSE Group does not promote, sponsor or endorse the content of this communication. The index is unmanaged and cannot be invested in directly.
BLOOMBERG® is a trademark and service mark of Bloomberg Finance L.P. and its affiliates (collectively “Bloomberg”). Bloomberg or Bloomberg’s licensors own all proprietary rights in the Bloomberg Indices. Neither Bloomberg nor Bloomberg’s licensors approves or endorses this material, or guarantees the accuracy or completeness of any information herein, or makes any warranty, express or implied, as to the results to be obtained therefrom and, to the maximum extent allowed by law, neither shall have any liability or responsibility for injury or damages arising in connection therewith.
The MSCI information may only be used for your internal use, may not be reproduced or redisseminated in any form and may not be used as a basis for or a component of any financial instruments or products or indices. None of the MSCI information is intended to constitute investment advice or a recommendation to make (or refrain from making) any kind of investment decision and may not be relied on as such. Historical data and analysis should not be taken as an indication or guarantee of any future performance analysis, forecast or prediction. The MSCI information is provided on an “as is” basis and the user of this information assumes the entire risk of any use made of this information. MSCI, each of its affiliates and each other person involved in or related to compiling, computing or creating any MSCI information (collectively, the “MSCI Parties”) expressly disclaims all warranties (including, without limitation, any warranties of originality, accuracy, completeness, timeliness, non-infringement, merchantability and fitness for a particular purpose) with respect to this information. Without limiting any of the foregoing, in no event shall any MSCI Party have any liability for any direct, indirect, special, incidental, punitive, consequential (including, without limitation, lost profits) or any other damages. (www.msci.com)
Capital believes the software and information from FactSet to be reliable. However, Capital cannot be responsible for inaccuracies, incomplete information or updating of the information furnished by FactSet. The information provided in this report is meant to give you an approximate account of the fund/manager's characteristics for the specified date. This information is not indicative of future Capital investment decisions and is not used as part of our investment decision-making process.
Indices are unmanaged and cannot be invested in directly. Returns represent past performance, are not a guarantee of future performance, and are not indicative of any specific investment.
All Capital Group trademarks are owned by The Capital Group Companies, Inc. or an affiliated company in Canada, the U.S. and other countries. All other company names mentioned are the property of their respective companies.
Capital Group funds are offered in Canada by Capital International Asset Management (Canada), Inc., part of Capital Group, a global investment management firm originating in Los Angeles, California in 1931. Capital Group manages equity assets through three investment groups. These groups make investment and proxy voting decisions independently. Fixed income investment professionals provide fixed income research and investment management across the Capital organization; however, for securities with equity characteristics, they act solely on behalf of one of the three equity investment groups.
The Capital Group funds offered on this website are available only to Canadian residents.