Global Equities
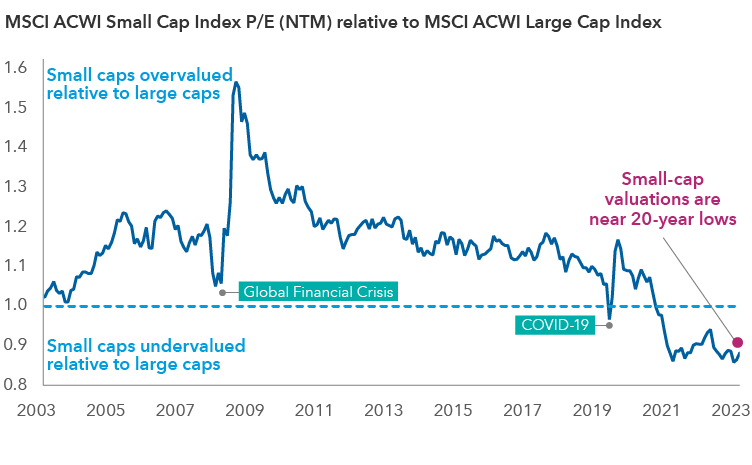
Over the last couple of years, the gap in both returns and valuations between small-cap and large-cap stocks has expanded against the backdrop of tighter monetary policy, higher interest rates and fears of a global economic slowdown. The MSCI ACWI Small-Cap Index is trading near a 20-year low on a relative basis versus large caps. Now, as the U.S. Federal Reserve appears to be pivoting to a more dovish stance, potentially leading to an easing of financial conditions, the outlook for small cap stocks is brightening.
The path for small cap companies—or those with a market value of US$6 billion or less—to obtain financing should be easier. And the initial public offering (IPO) pipeline, which had shriveled to a trickle, should start to flow again, providing a fresh set of opportunities.
That said, a supportive macro-economic backdrop is only part of the overall story for small-cap stocks. These companies often need a structural growth runway to thrive. And many of the opportunities can be quite idiosyncratic or specific to each company.
Relative valuations for small caps are near 20-year lows

Sources: Capital Group, FactSet, MSCI. As of December 31, 2023. P/E = price-to-earnings. NTM = next twelve months. P/E = price-to-earnings. NTM = next twelve months. The Y-axis represents the ratio between the P/E of MSCI ACWI Small Cap Index and the P/E of the MSCI ACWI Large Cap Index.
Small-cap stocks also tend to be associated with the U.S., the largest category in this asset class. But we are finding an increasing number of opportunities around the world, in markets that one might not typically think of as havens for smaller innovative growth companies, such as Japan, the Nordic countries of Sweden and Norway, southern European countries such as Greece, and prominent Asian markets, notably India.
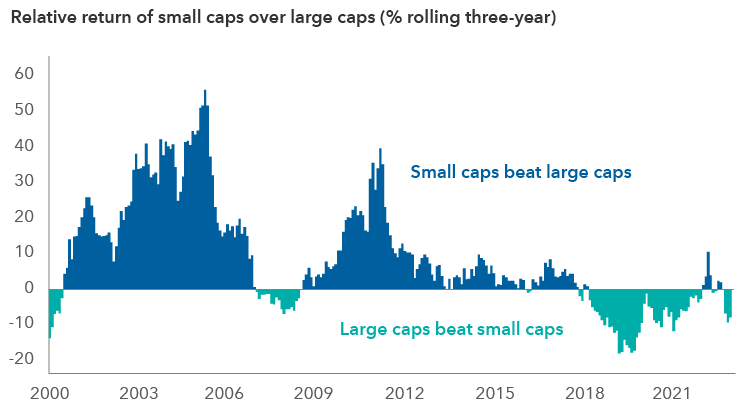
And despite lagging large caps in recent years, smaller companies have been an important source of return in global equity markets. They have outpaced their larger brethren close to 70% of the time in rolling three-year periods since 2000. In this article, we highlight areas of opportunity that we find illustrate the multi-faceted and dynamic nature of the global small-cap space.
1. Growing tailwinds from global infrastructure build
Heating systems, insulation products and trucking companies are not glamorous businesses when compared to the sizzling world of artificial intelligence (AI) and the latest tech innovations. Yet, these nuts-and-bolts industrial companies are getting much of our attention.
Historically, small caps have outperformed large caps

Sources: Capital Group, MSCI, Refinitiv. As of December 31, 2023. Large caps are represented by MSCI ACWI. Small caps are represented by the MSCI ACWI Small Cap Index. Returns use cumulative total returns in USD, on a three-year rolling basis.
Deteriorating U.S. infrastructure and government willingness to upgrade it – from electric grids to pipelines, combined with a desire by companies to have better security around supply chains – has brought new life to the industrial complex.
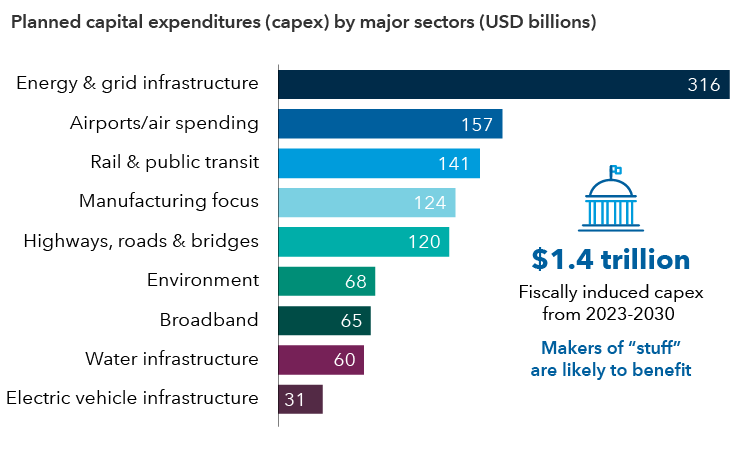
Significant investments from governments and multinationals are expected to be a source of sustained demand in the years ahead. The U.S. government, for instance, has committed US$1.4 trillion over the next seven years to rebuild America's infrastructure and reshape the manufacturing, semiconductor and energy industries.
Of interest are businesses that supply heating, ventilation and air conditioning system installation services (HVAC). This is an area of growth where smaller companies have carved out market share and hard-to-replicate distribution networks, affording them pricing power.
For example, Comfort Systems, one of the larger HVAC companies in the U.S. market, has reported a robust pipeline of projects tied to new semiconductor, computer data centre and electric vehicle battery plants. Its US$4.3 billion backlog as of September 30 was US$1 billion higher than the same 2022 period. This is not just a U.S. phenomenon. HVAC firms based in Italy and Switzerland have benefited from Europe's push to make more buildings and homes energy efficient.
2. European industrial rollups offer compelling business models
We are finding that European industrials, especially in the Nordic countries, that utilize mergers and acquisitions (M&A) can be true value creators. Acquisitive industrial firms that roll up companies under one hood have shown they can profitably scale, providing compelling total returns over longer periods through a combination of dividends, organic growth and acquired earnings from M&A.
These companies aim to create value for shareholders through smart capital allocation and growing their business through either vertical or horizontal expansion. Their philosophy is quite simple: They usually acquire companies with under US$10 million of annual revenue for less than 10 times earnings before taxes and interest. After the acquisition, they keep these businesses independent of each other in a decentralized operating model.
Coming to America: a tidal wave of government spending on infrastructure

Sources: White House.gov, McKinsey, U.S. Department of Transportation, Fundamental Research Group, Haver Analytics, Capital Strategy Research and Capital Group. EV = electric vehicle. Data as of June 2023.
Given their deal sizes are small, these roll up industrial firms face less competition from private equity buyers and can pay lower valuation multiples. This business model is more prevalent in Europe relative to the U.S., which has a greater pool of buyers among private equity shops and hedge funds, who tend to put greater emphasis on financial efficiency over synergy among like businesses.
3. AI evolution presents opportunities
The evolution of AI applications will have a significant impact across industries. Since the technology is still in the early stages, we are being selective. Among the businesses that stand to benefit from AI’s initial development are suppliers to the semiconductor industry as well as information technology (IT) services firms.
One is the production of specialized chemicals, gases and adhesives used in semiconductor production and packaging, particularly for memory and data-centre server chips. A few Japanese companies dominate this area. These are monopolistic-like businesses that will be hard to dislodge. Overall, AI is driving growth in the global semiconductor industry as high-performance computing chips are needed to power AI-applications and reduce heat in data centres.
IT services companies are seeing increased work for AI-related projects as large corporations spend to upgrade existing technology. For example, Argentina's Globant SA, which works in 30 countries and whose clients include Google and Walt Disney, recently noted that "AI will be the dominant growth driver in the IT services market." It said demand was high for AI-driven experiences across industries.
IT services firms are likely to benefit near term, but in the long run they may be more challenged, especially if AI displaces software engineers employed by the IT service companies.
4. India is a fertile ground for small caps
India's booming economy, growing housing market and digital infrastructure make the country an attractive hunting ground to identify fast growing companies. The range of opportunities within India's small-cap landscape has expanded as pro-business and market reforms have gained traction, helping to facilitate the expansion of credit and formalize the economy.
Significant government investment in infrastructure, increasing domestic consumption and India's rise as an alternative to China for manufacturing mobile phones, home appliances and computers has steadily broadened the opportunity set. These range from beverage producers to chemical suppliers to building products companies and private hospital operators. There are also more prospects in the financial sector, with a new crop of wealth management firms, home mortgage lenders and mobile-based consumer finance platforms.
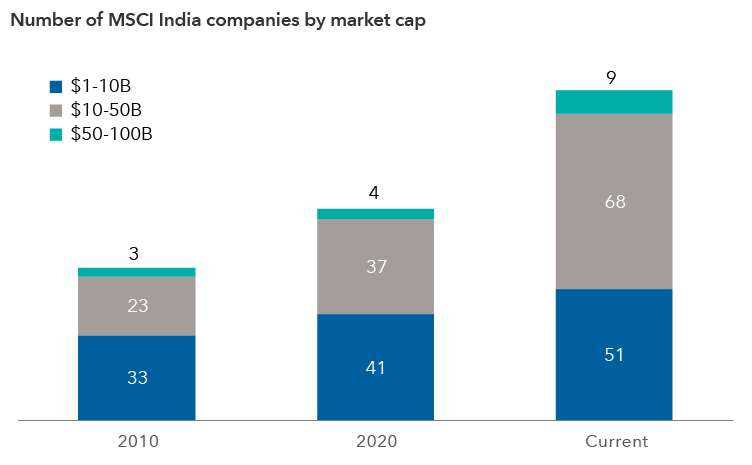
We've also seen an increase in the number of small and mid-sized companies listing their shares on public equity markets.
India's equity market has expanded in the small- and mid-cap space

Sources: Capital Group, MSCI, RIMES. Current data as of January 31, 2024. Values in USD.
The challenge is that valuations in aggregate appear stretched. India's stock market is trading at record highs and valuations have gotten expensive in some cases. The MSCI India Index traded at 21.7 times forward earnings versus its 10-year average of 18.8 times (as of January 30). We remain selective but also recognize that this is a high growth market. For example, if a company is currently trading at 40 times earnings with potential to grow earnings by 20% per year for the foreseeable future, the stock may be fairly valued and not that expensive in the long run. For these reasons, we believe it's important to do bottom-up research to sift through these opportunities.
5. Greek banks provide unique opportunity
Greece has undergone a remarkable transformation after running into severe debt troubles that required three financial bailouts from 2012 to 2015. Today the country is no longer in financial distress. Greece is one of Europe's fastest-growing economies following a series of reforms under its pro-market government, and its sovereign debt has been upgraded to investment grade (BBB/Baa and above) by credit rating agencies.
The country's commercial banking market is vastly different, having shrunk from roughly 25 banks to a handful today. The banks are over-capitalized and there's less competition for loans, which has resulted in a low-cost deposit base compared with other European countries. Overall, Greek banks trade at attractive valuations on a relative basis and there's potential for dividends, which could boost total stock returns.
By contrast, we find small-cap U.S. banks more challenged, especially after the 2023 collapse of Silicon Valley Bank and a few other regionals. Many are overexposed to commercial real estate, have higher deposit funding costs versus the large banks and are constrained to invest in new technologies.
6. Biotechnology may bounce back
We may be at a trough for valuations in the biotechnology sector. Equity prices in this space tend to move with funding cycles, and if interest rates move lower, it could be a catalyst for improved sentiment. A pickup in M&A activity over the past couple of months appears to signal such a shift, and we are looking for opportunities after valuations got crushed when rates spiked. While the market last year was fascinated by the potential for obesity drugs, we believe the innovation and product cycle is vibrant for other kinds of drugs to treat a range of diseases. Alzheimer's is one such area. Another potential growth area is in companies that supply specialized tools and materials needed by global pharmaceutical giants.
7. The IPO market may thaw with reasonably priced deals
The IPO market may yield opportunities to selectively invest in promising companies at reasonable valuations. With expectations that major global central banks are nearing the end of a rate-hiking cycle, there is hope that IPO activity can rebound after a quiet couple of years.
Historically, we have found that following periods of diminished IPOs, higher quality companies with better-run businesses and prospects are often the first ones brought to market by investment banks. These deals are usually offered at more palatable valuations versus times when the IPO market is red hot and less mature companies can tap the markets.
In 2023, we also saw a geographical shift in the IPO market. Deal activity was stronger in faster-growing emerging markets. India, Saudi Arabia and Thailand all posted an increase in the number of deals, with Indonesia and Turkey climbing above the five-year average.
Taking a measured approach
Small caps are at the centre of a lot of innovation around the world — new technologies, new approaches to doing business, new markets and products. What decades ago, was largely a U.S. phenomenon has become more global as entrepreneurship flourishes across industries. Of course, given the nature of smaller companies, many of them can also fall by the wayside when new trends emerge. Therefore, we remain selective and measured in our investments in small-cap stocks.
Many of these businesses are also sensitive to shifts in interest rates and the pace of global economic growth, both of which can be difficult to predict with certainty. We've been focused on companies with unique business models or that appear positioned to prosper from secular growth trends over this decade. As investors who buy stocks on a company-by-company basis, we have sought to take advantage of dislocations in the market and believe the opportunity is ripe to buy promising companies at valuations that in aggregate appear very reasonable by historical measures.
The MSCI All Country World Index (ACWI) is a free float-adjusted market capitalization weighted index that is designed to measure equity market results in the global developed and emerging markets, consisting of more than 40 developed and emerging market country indices.
The MSCI India Index is designed to measure the performance of the large and mid-cap segments of the Indian market.
The MSCI All Country World Small Cap Index captures small cap representation across 23 developed markets and 24 emerging markets countries.
The MSCI All Country World Large Cap Index captures large cap representation across 23 developed markets and 24 emerging markets countries.
Our latest insights
-
-
Currencies
-
Market Volatility
-
Market Volatility
-
Markets & Economy
RELATED INSIGHTS
-
Emerging Markets
-
Global Equities
-
Economic Indicators
Commissions, trailing commissions, management fees and expenses all may be associated with investments in investment funds. Please read the prospectus before investing. Investment funds are not guaranteed or covered by the Canada Deposit Insurance Corporation or by any other government deposit insurer. For investment funds other than money market funds, their values change frequently. For money market funds, there can be no assurances that the fund will be able to maintain its net asset value per security at a constant amount or that the full amount of your investment in the fund will be returned to you. Past performance may not be repeated.
Unless otherwise indicated, the investment professionals featured do not manage Capital Group‘s Canadian investment funds.
References to particular companies or securities, if any, are included for informational or illustrative purposes only and should not be considered as an endorsement by Capital Group. Views expressed regarding a particular company, security, industry or market sector should not be considered an indication of trading intent of any investment funds or current holdings of any investment funds. These views should not be considered as investment advice nor should they be considered a recommendation to buy or sell.
Statements attributed to an individual represent the opinions of that individual as of the date published and do not necessarily reflect the opinions of Capital Group or its affiliates. This information is intended to highlight issues and not be comprehensive or to provide advice. For informational purposes only; not intended to provide tax, legal or financial advice. Capital Group funds are available in Canada through registered dealers. For more information, please consult your financial and tax advisors for your individual situation.
Forward-looking statements are not guarantees of future performance, and actual events and results could differ materially from those expressed or implied in any forward-looking statements made herein. We encourage you to consider these and other factors carefully before making any investment decisions and we urge you to avoid placing undue reliance on forward-looking statements.
The S&P 500 Composite Index (“Index”) is a product of S&P Dow Jones Indices LLC and/or its affiliates and has been licensed for use by Capital Group. Copyright © 2025 S&P Dow Jones Indices LLC, a division of S&P Global, and/or its affiliates. All rights reserved. Redistribution or reproduction in whole or in part are prohibited without written permission of S&P Dow Jones Indices LLC.
FTSE source: London Stock Exchange Group plc and its group undertakings (collectively, the "LSE Group"). © LSE Group 2025. FTSE Russell is a trading name of certain of the LSE Group companies. "FTSE®" is a trade mark of the relevant LSE Group companies and is used by any other LSE Group company under licence. All rights in the FTSE Russell indices or data vest in the relevant LSE Group company which owns the index or the data. Neither LSE Group nor its licensors accept any liability for any errors or omissions in the indices or data and no party may rely on any indices or data contained in this communication. No further distribution of data from the LSE Group is permitted without the relevant LSE Group company's express written consent. The LSE Group does not promote, sponsor or endorse the content of this communication. The index is unmanaged and cannot be invested in directly.
BLOOMBERG® is a trademark and service mark of Bloomberg Finance L.P. and its affiliates (collectively “Bloomberg”). Bloomberg or Bloomberg’s licensors own all proprietary rights in the Bloomberg Indices. Neither Bloomberg nor Bloomberg’s licensors approves or endorses this material, or guarantees the accuracy or completeness of any information herein, or makes any warranty, express or implied, as to the results to be obtained therefrom and, to the maximum extent allowed by law, neither shall have any liability or responsibility for injury or damages arising in connection therewith.
The MSCI information may only be used for your internal use, may not be reproduced or redisseminated in any form and may not be used as a basis for or a component of any financial instruments or products or indices. None of the MSCI information is intended to constitute investment advice or a recommendation to make (or refrain from making) any kind of investment decision and may not be relied on as such. Historical data and analysis should not be taken as an indication or guarantee of any future performance analysis, forecast or prediction. The MSCI information is provided on an “as is” basis and the user of this information assumes the entire risk of any use made of this information. MSCI, each of its affiliates and each other person involved in or related to compiling, computing or creating any MSCI information (collectively, the “MSCI Parties”) expressly disclaims all warranties (including, without limitation, any warranties of originality, accuracy, completeness, timeliness, non-infringement, merchantability and fitness for a particular purpose) with respect to this information. Without limiting any of the foregoing, in no event shall any MSCI Party have any liability for any direct, indirect, special, incidental, punitive, consequential (including, without limitation, lost profits) or any other damages. (www.msci.com)
Capital believes the software and information from FactSet to be reliable. However, Capital cannot be responsible for inaccuracies, incomplete information or updating of the information furnished by FactSet. The information provided in this report is meant to give you an approximate account of the fund/manager's characteristics for the specified date. This information is not indicative of future Capital investment decisions and is not used as part of our investment decision-making process.
Indices are unmanaged and cannot be invested in directly. Returns represent past performance, are not a guarantee of future performance, and are not indicative of any specific investment.
All Capital Group trademarks are owned by The Capital Group Companies, Inc. or an affiliated company in Canada, the U.S. and other countries. All other company names mentioned are the property of their respective companies.
Capital Group funds are offered in Canada by Capital International Asset Management (Canada), Inc., part of Capital Group, a global investment management firm originating in Los Angeles, California in 1931. Capital Group manages equity assets through three investment groups. These groups make investment and proxy voting decisions independently. Fixed income investment professionals provide fixed income research and investment management across the Capital organization; however, for securities with equity characteristics, they act solely on behalf of one of the three equity investment groups.
The Capital Group funds offered on this website are available only to Canadian residents.
 Dimitrije Mitrinovic
 Roz Hongsaranagon