Economic Indicators
 Jared Franz
In the 2008 movie, The Curious Case of Benjamin Button, the title character played by Brad Pitt ages in reverse, transitioning over time from an old man to a young child. Oddly enough, I think the U.S. economy is doing something similar.
Instead of the typical four-stage business cycle — early, mid, late and recession — we have witnessed since the end of World War II, the economy appears to be transitioning from late-cycle characteristics of tight monetary policy and rising cost pressures back to mid-cycle, where corporate profits tend to peak, credit demand picks up and monetary policy is generally neutral.
The next step should have been recession but, in my view, we have clearly avoided that painful part of the business cycle and essentially moved backward in economic time to a healthier condition.
U.S. economy goes back to the future
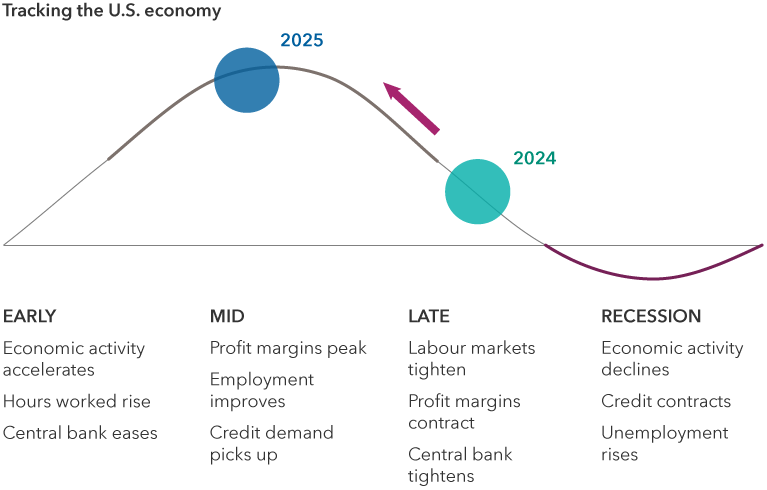
Source: Capital Group. Positions within the business cycle are forward-looking estimates by Capital Group economists as of December 2023 (2024 bubble) and September 2024 (2025 bubble). The views of individual portfolio managers and analysts may differ.
How did this happen? Much like the movie, it’s a bit of a mystery, but I think the Benjamin Button economy has resulted largely from post-pandemic distortions in the U.S. labour market that were signaling late-cycle conditions. However, other broader economic indicators that I think may be more reliable today are flashing mid-cycle.
If the U.S. economy is mid-cycle, as I believe, then we could be on the way to a multi-year expansion period that may not produce a recession until 2028. In the past, this type of economic environment has produced stock market returns in the range of 14% a year and provided generally favourable conditions for bonds.
The unemployment rate gap
Stay with me for a moment while I explain my methodology. Instead of using standard U.S. unemployment figures to determine U.S. business cycle stages, I prefer to look at the unemployment rate gap. That’s the gap between the actual unemployment rate (currently 4.2%) and the natural rate of unemployment, often referred to as the non-accelerating inflation rate of unemployment, or NAIRU. That number typically falls in a range from 5.0% to 6.0%. Simply put, it’s the level of unemployment below which inflation would be expected to rise.
While this is a summary measure of dating the business cycle, it is based on a more comprehensive approach that looks at monetary policy, cost pressures, corporate profit margins, capital expenditures and overall economic output.
The unemployment gap is a measure that can be tracked each month with the release of the U.S. employment report. The reason it has worked so well is because the various gap stages tend to correlate with the underlying factors of each business cycle. For example, when labour markets are tight, cost pressures tend to be high, corporate profits fall and the economy tends to be late cycle.
Unemployment data signals rise of a mid-cycle economy

Source: Capital Group. The unemployment rate gap is the distance between the actual unemployment rate and the natural rate of unemployment. Business cycles are forward-looking estimates by Capital Group economists. The views of individual portfolio managers and analysts may differ. As of July 31, 2024.
This approach also worked nicely in pre-pandemic times, providing an early warning signal of late-cycle economic vulnerability in 2019. That was followed by the brief COVID recession from February 2020 to April 2020.
It’s likely that the pandemic has distorted the U.S. labour market, structurally and cyclically. For example, the labour force participation rate experienced an unprecedented decline as global economic activity came to a virtual standstill. That was followed by a remarkable rebound in the participation rate above pre-pandemic levels for prime-age (25- to 54-year-old) workers.
In other words, traditional ways of looking at the unemployment picture are now less useful tools for calibrating broader economic conditions. They’ve become less correlated with classic business cycle dynamics. Not recognizing these changes can lead to overly optimistic or overly pessimistic assessments of the cycle.
Market implications: Stocks and bonds could do well
My macroeconomic view drives my equity market view. As I said, an economy that is mid-cycle has tended to produce equity returns of approximately 14% on an annualized basis. Small-cap stocks have generally outpaced large caps, value has outpaced growth, and the materials and real estate sectors have generated the best returns. These figures are based on a Capital Group assessment of market returns from December 1973 to August 2024.
As always, it’s important to acknowledge that past results are not reflective of results in future periods. But if the U.S. economy continues to grow at a healthy rate — 2.5% to 3.0% in my estimation — that should provide a nice tailwind for equity prices. Over long periods of time, when the U.S. economy grows above its potential 2.0% growth rate, that type of environment has generally supported better-than-average stock market returns.
A mid-cycle economy has provided favourable market returns

Sources: Capital Group, MSCI. Data is monthly from December 1973 to August 2024. Total index data is Datastream U.S. Total Market Index from December 31, 1973, through December 31, 1994, and MSCI USA Index data thereafter. Sectors are Datastream sectors from December 31, 1973, through December 31, 1994, and GICS (MSCI) sectors thereafter. Business cycles are forward-looking estimates by Capital Group economists. The views of individual portfolio managers and analysts may differ. As of July 31, 2024.
Mid-cycle economies have also generally produced a favourable backdrop for fixed income markets. During the same period referenced above, long-term U.S. government bonds returned 4.7% on an annualized basis, while long-term corporate bonds returned 5.0%.
If the U.S. Federal Reserve continues to cut interest rates, I believe that could provide an even more favourable environment for bonds over the next few years. Given my positive economic outlook, I don’t think the Fed will reduce rates as much as the market expects. Inflation hasn’t been defeated quite yet. It’s still slightly above the Fed’s 2% target, so following last week’s 50 basis point cut, I think central bank officials will be cautious about future rate cut actions.
Election uncertainty? Not really
With U.S. elections about a month away, you may be wondering if my outlook for the economy and markets will change depending on the outcome. The answer is no. Over the years, I’ve learned to be election agnostic. Promises made on the campaign trail often look nothing like the policies enacted after Election Day and, therefore, I generally avoid taking political considerations into account.
As an economist, I believe political gridlock is not all bad, and it has tended to be the norm in recent decades. I think we are likely to see a split government again in 2025, with neither party gaining full control of the White House, the Senate and the House of Representatives. That should narrow the potential for wild policy swings and put the focus back on the fundamentals: the economy, the consumer and corporate earnings.
The Datastream U.S. Total Market Index measures the results of the U.S. equity market, including large-, mid- and small-capitalization stocks.
The MSCI USA Index is a free float-adjusted, market capitalization-weighted index designed to measure the equity market results in the United States.
Long-term government and corporate bond returns are based on the Bloomberg U.S. Long Treasury Index and the Bloomberg Long U.S. Corporate Index, respectively. The Bloomberg U.S. Long Treasury Index measures the results of fixed-rate, nominal debt issued by the U.S. Treasury with a maturity greater than 10 years. The Bloomberg Long U.S. Corporate Index measures the results of U.S. corporate bonds with a maturity of at least 10 years.
Our latest insights
-
-
Currencies
-
Market Volatility
-
Market Volatility
-
Markets & Economy
RELATED INSIGHTS
Commissions, trailing commissions, management fees and expenses all may be associated with investments in investment funds. Please read the prospectus before investing. Investment funds are not guaranteed or covered by the Canada Deposit Insurance Corporation or by any other government deposit insurer. For investment funds other than money market funds, their values change frequently. For money market funds, there can be no assurances that the fund will be able to maintain its net asset value per security at a constant amount or that the full amount of your investment in the fund will be returned to you. Past performance may not be repeated.
Unless otherwise indicated, the investment professionals featured do not manage Capital Group‘s Canadian investment funds.
References to particular companies or securities, if any, are included for informational or illustrative purposes only and should not be considered as an endorsement by Capital Group. Views expressed regarding a particular company, security, industry or market sector should not be considered an indication of trading intent of any investment funds or current holdings of any investment funds. These views should not be considered as investment advice nor should they be considered a recommendation to buy or sell.
Statements attributed to an individual represent the opinions of that individual as of the date published and do not necessarily reflect the opinions of Capital Group or its affiliates. This information is intended to highlight issues and not be comprehensive or to provide advice. For informational purposes only; not intended to provide tax, legal or financial advice. Capital Group funds are available in Canada through registered dealers. For more information, please consult your financial and tax advisors for your individual situation.
Forward-looking statements are not guarantees of future performance, and actual events and results could differ materially from those expressed or implied in any forward-looking statements made herein. We encourage you to consider these and other factors carefully before making any investment decisions and we urge you to avoid placing undue reliance on forward-looking statements.
The S&P 500 Composite Index (“Index”) is a product of S&P Dow Jones Indices LLC and/or its affiliates and has been licensed for use by Capital Group. Copyright © 2025 S&P Dow Jones Indices LLC, a division of S&P Global, and/or its affiliates. All rights reserved. Redistribution or reproduction in whole or in part are prohibited without written permission of S&P Dow Jones Indices LLC.
FTSE source: London Stock Exchange Group plc and its group undertakings (collectively, the "LSE Group"). © LSE Group 2025. FTSE Russell is a trading name of certain of the LSE Group companies. "FTSE®" is a trade mark of the relevant LSE Group companies and is used by any other LSE Group company under licence. All rights in the FTSE Russell indices or data vest in the relevant LSE Group company which owns the index or the data. Neither LSE Group nor its licensors accept any liability for any errors or omissions in the indices or data and no party may rely on any indices or data contained in this communication. No further distribution of data from the LSE Group is permitted without the relevant LSE Group company's express written consent. The LSE Group does not promote, sponsor or endorse the content of this communication. The index is unmanaged and cannot be invested in directly.
BLOOMBERG® is a trademark and service mark of Bloomberg Finance L.P. and its affiliates (collectively “Bloomberg”). Bloomberg or Bloomberg’s licensors own all proprietary rights in the Bloomberg Indices. Neither Bloomberg nor Bloomberg’s licensors approves or endorses this material, or guarantees the accuracy or completeness of any information herein, or makes any warranty, express or implied, as to the results to be obtained therefrom and, to the maximum extent allowed by law, neither shall have any liability or responsibility for injury or damages arising in connection therewith.
The MSCI information may only be used for your internal use, may not be reproduced or redisseminated in any form and may not be used as a basis for or a component of any financial instruments or products or indices. None of the MSCI information is intended to constitute investment advice or a recommendation to make (or refrain from making) any kind of investment decision and may not be relied on as such. Historical data and analysis should not be taken as an indication or guarantee of any future performance analysis, forecast or prediction. The MSCI information is provided on an “as is” basis and the user of this information assumes the entire risk of any use made of this information. MSCI, each of its affiliates and each other person involved in or related to compiling, computing or creating any MSCI information (collectively, the “MSCI Parties”) expressly disclaims all warranties (including, without limitation, any warranties of originality, accuracy, completeness, timeliness, non-infringement, merchantability and fitness for a particular purpose) with respect to this information. Without limiting any of the foregoing, in no event shall any MSCI Party have any liability for any direct, indirect, special, incidental, punitive, consequential (including, without limitation, lost profits) or any other damages. (www.msci.com)
Capital believes the software and information from FactSet to be reliable. However, Capital cannot be responsible for inaccuracies, incomplete information or updating of the information furnished by FactSet. The information provided in this report is meant to give you an approximate account of the fund/manager's characteristics for the specified date. This information is not indicative of future Capital investment decisions and is not used as part of our investment decision-making process.
Indices are unmanaged and cannot be invested in directly. Returns represent past performance, are not a guarantee of future performance, and are not indicative of any specific investment.
All Capital Group trademarks are owned by The Capital Group Companies, Inc. or an affiliated company in Canada, the U.S. and other countries. All other company names mentioned are the property of their respective companies.
Capital Group funds are offered in Canada by Capital International Asset Management (Canada), Inc., part of Capital Group, a global investment management firm originating in Los Angeles, California in 1931. Capital Group manages equity assets through three investment groups. These groups make investment and proxy voting decisions independently. Fixed income investment professionals provide fixed income research and investment management across the Capital organization; however, for securities with equity characteristics, they act solely on behalf of one of the three equity investment groups.
The Capital Group funds offered on this website are available only to Canadian residents.