Trade
 Jared Franz
 Robert Lind
Tariff is a word most of us first heard in high school history class. We remember something about the U.S. Smoot-Hawley Tariff Act of 1930, Canadian Prime Minister R.B. Bennett’s stiff retaliatory response and how it ended badly for both countries in the Great Depression. Fast forward to today and tariffs are once again taking centre stage, serving as the linchpin of President Trump’s trade policy — and as a cause of sharply rising market volatility. A fierce debate has emerged over the impact they could have on the global economy.
Critics argue these tariffs mark the start of a new trade war that will hurt all countries in the end. Supporters say it’s an attempt by the U.S. to reduce long-term trade deficits and compel other countries to lower their own protectionist measures. In either case, the rewiring of global trade reflects a larger shift in the geopolitical world order that is, in our view, just beginning.
To help make sense of it all, we developed this guide to tariffs and their potential implications for the economy, markets and investors.
1. What are tariffs and how are they used?
Tariffs are essentially taxes on goods imported from other countries. They are used to help protect domestic producers from foreign competition, among other purposes.
We employ a four-box framework to understand the motivations for tariffs and what they could mean for the investment environment. Four main factors — decoupling, rebalancing, negotiating and funding — will influence how the story plays out. For instance, tariffs used for negotiating purposes are unlikely to persist over long periods of time while those that are part of a larger decoupling process could be here to stay.
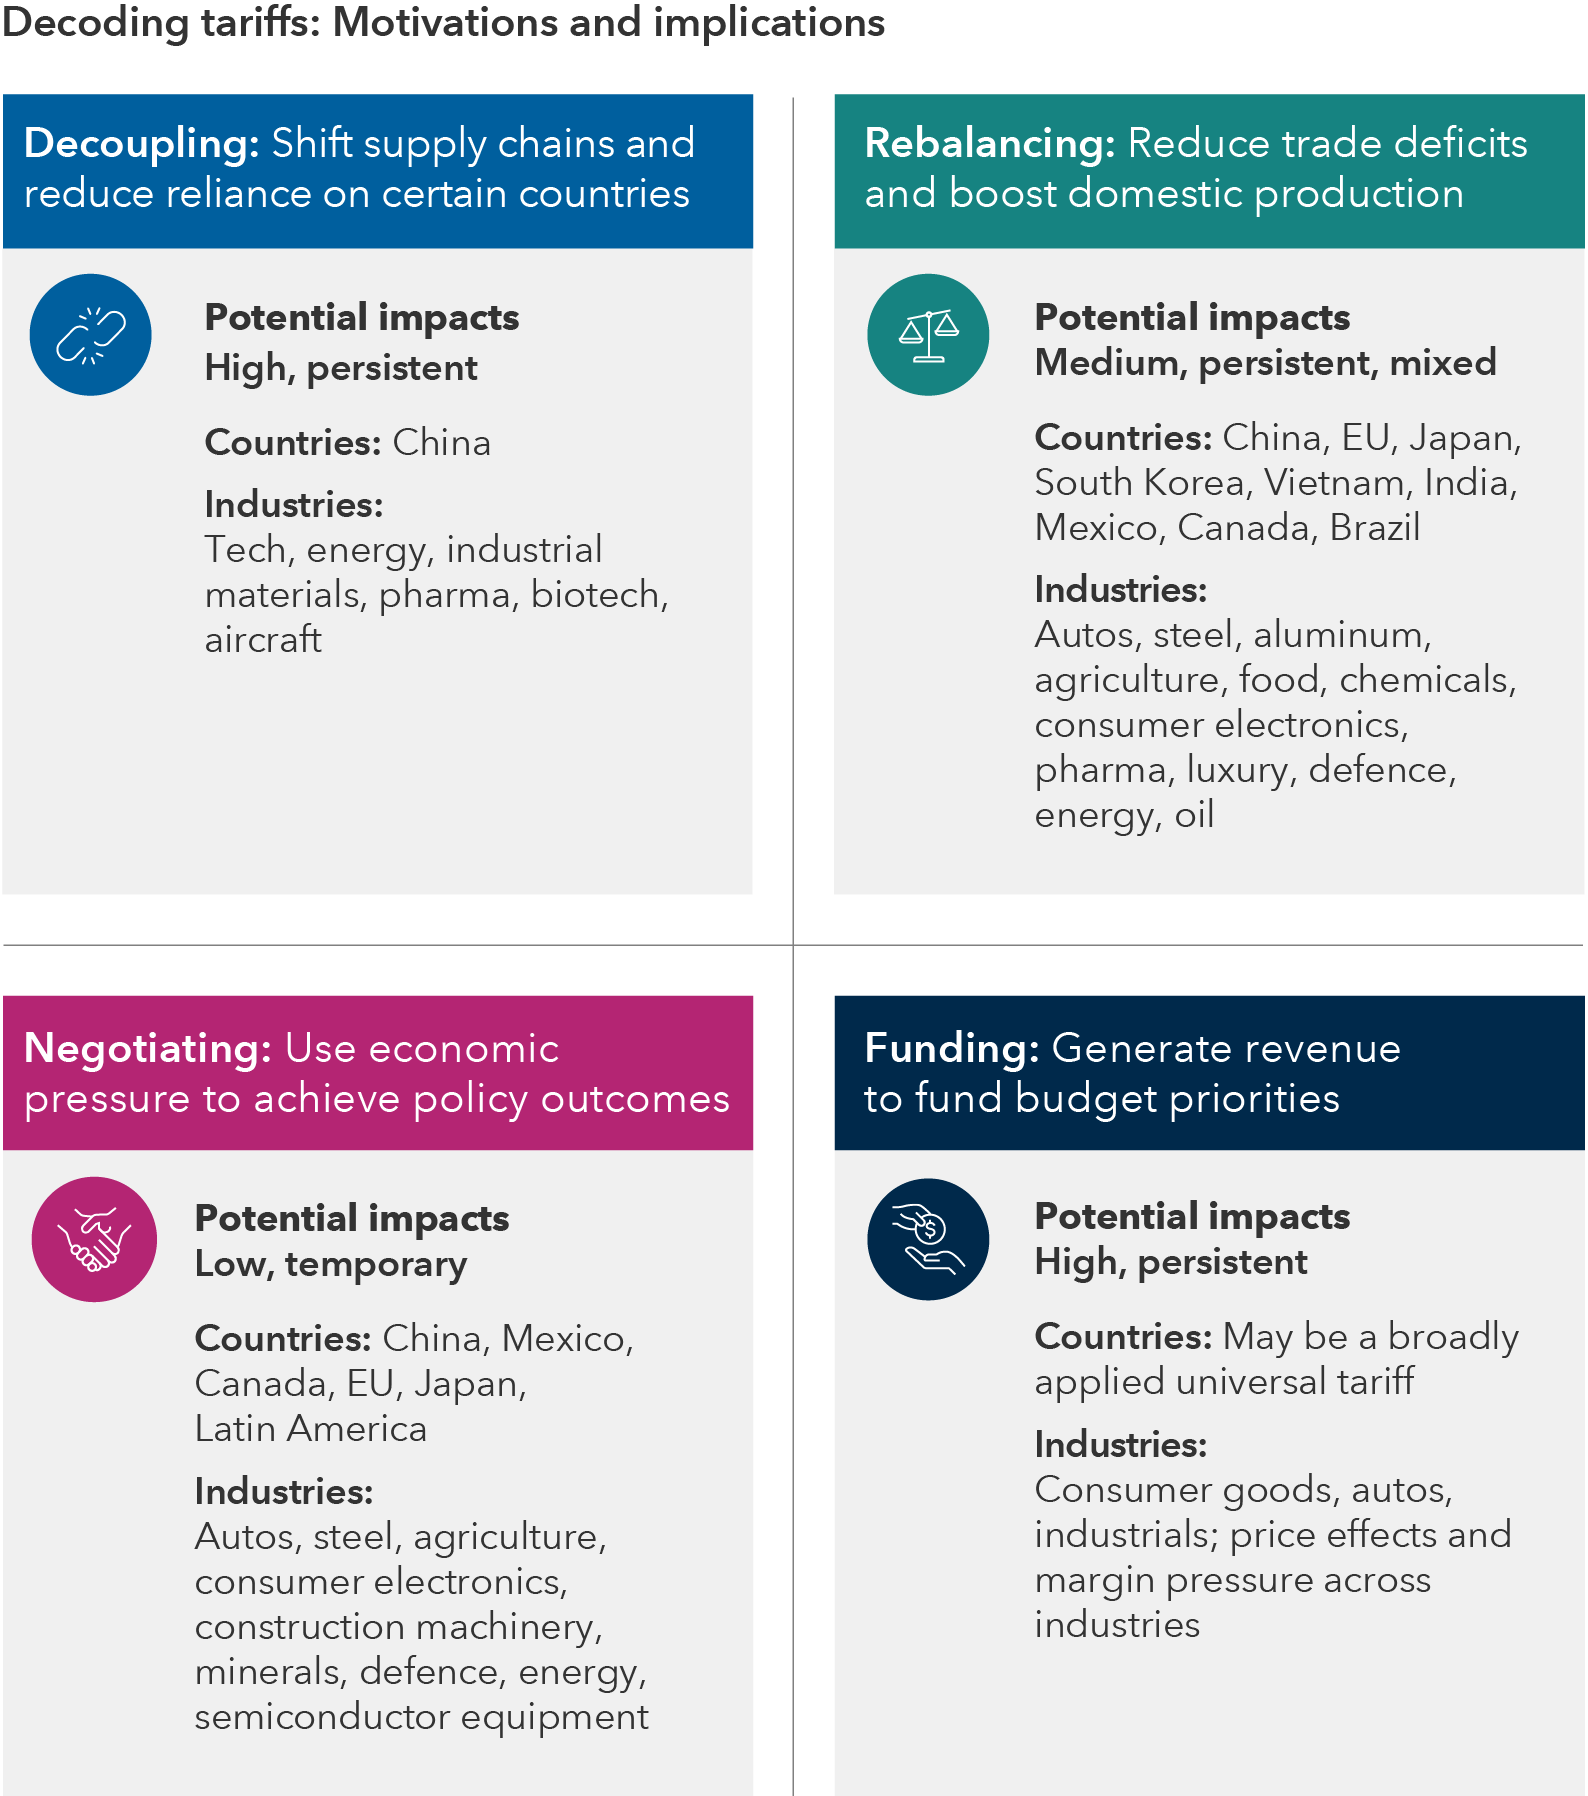
Sources: Capital Group, American Compass. As of March 5, 2025.
Our base case is that the United States can weather changes to trade policies, though higher tariffs would likely dampen economic activity and raise import prices. The U.S. has the advantages of size, economic resilience and consumers with money to spend. Businesses have also ramped up investments in the U.S., both domestically and abroad from companies eager to maintain access to the world’s largest economy.
However, the ambiguity caused by shifting trade policies is already affecting business and consumer confidence, with potential negative consequences for the U.S. economy and markets.
The fallout for other countries also remains uncertain, particularly those that rely heavily on the U.S. for trade, such as Mexico and Canada, where exports to the U.S. account for around 20% to 25% of GDP. For most European economies, exports to the U.S. make up approximately 2% to 3% of their GDP. If the U.S. imposes tariffs, resulting in lower exports and economic growth for these countries, then we are likely to see looser macroeconomic policy to counter the negative effects. Some governments are responding decisively. Germany, for example, has relaxed its fiscal policy dramatically and laid out plans to increase spending for infrastructure and defence, in part to reduce reliance on exports for growth.
2. Why is the U.S. trade deficit so high?
If there’s one number to know about tariffs, it’s the U.S. trade deficit for goods. That figure hit US$1.1 trillion in 2024 as Americans bought imported products and a strong U.S. dollar weighed on exports. The U.S. has run a trade deficit every year since the 1970s.
The U.S. trade deficit surged to near record highs in 2024

Sources: Capital Group, Bureau of Economic Analysis. Figures reflect 12-month totals through September of each year. As of September 30, 2024.
Economists note the high trade deficit may be a sign of U.S. economic strength — indicating consumers are buying — but the figure is nonetheless why tariffs are central to Trump’s economic agenda. Other countries rely on global trade far more than the United States, and the administration aims to leverage America’s economic position as a tool to achieve a more balanced relationship with its trading partners.
Still, the U.S. runs the world’s largest current account deficit, which is the counterpart of huge foreign capital inflows into the U.S. If the U.S. wants to reduce its deficit, it will likely mean smaller capital inflows and a weaker dollar.
Trump’s novel use of emergency orders to implement or remove tariffs has unnerved markets. Prior administrations have used tariffs to varying degrees, but under laws that required detailed analysis, which allowed more time for companies and stakeholders to respond. Whatever the method, tariffs may represent a pivot to an isolationist-leaning policy that could have long-term ramifications for investment portfolios.
3. Do tariffs cause inflation?
The short answer is yes, but how it plays out is more complex.
In the event of a one-time tariff, prices would likely increase modestly but then even out over time. A more worrisome development is a trade war scenario, where tariffs ratchet up year to year. That, in turn, could lead to higher long-term inflation with a knock-on effect of rising interest rates.
Economists agree the cost of tariffs is largely paid for by a combination of consumers and companies willing to accept lower profit margins to sell products. A common estimate is that 30% to 50% of the cost is passed on to consumers, though the rate may be higher for products with fewer substitutes. Recent research has shown that the 2018–2019 tariffs were mostly passed on to U.S. consumers.
Trump’s decision to impose tariffs on imported washing machines, but not dryers, in January 2018, is an often-cited case study from economists at the University of Chicago and the U.S. Federal Reserve. The study found domestic U.S. manufacturers raised prices to match competitors, despite not being tariffed. Moreover, prices of dryers also increased as manufacturers may have used tariffs to raise prices opportunistically or split the increases between the washers and dryers.
Home appliance prices rose then stabilized under Trump

Sources: Capital Group, U.S. Bureau of Labor Statistics, Peterson Institute for International Economics. Retailer price change is represented by the Producer Price Index (PPI) retail trade for the major appliances subcategory. The PPI measures the average change over time in the selling prices received by domestic producers for their output. Consumer price change is represented by the U.S. Consumer Price Index for major appliances subcategory. As of December 15, 2019.
The value of the U.S. dollar has also changed in reaction to tariff headlines. Higher tariffs generally lead to a stronger dollar since they lower demand for imports priced in foreign currency. Conversely, limiting tariffs lowers the dollar’s value as demand for foreign currency increases. A strong dollar could help offset some tariff-related costs for consumers, similar to the way U.S. tourists benefit from a strong dollar when traveling abroad.
4. What is trade reciprocity and how will it unfold?
At face value, the concept of trade reciprocity is simple: We charge you the same tariffs that you charge us.
The Trump administration aims to rebalance tariffs between the U.S. and other countries to make them reciprocal. Such a move bucks 75 years of multilateral U.S. trade policy and sidesteps rules of the World Trade Organization, the successor to the General Agreement on Tariffs and Trade of 1947.
This change in strategy is happening because the U.S. administration believes the balance has tipped too far as key American industries face steep barriers to selling their products abroad. Take cars, for example. Auto sales between the U.S. and the European Union favour the latter. The EU currently imposes a 10% tariff on U.S. cars sold in their markets compared to the 2.5% rate imposed by the U.S. on imported European autos.
It’s unclear whether Trump’s definition of reciprocity would include value-added tax (VAT) rates charged by many countries on domestic purchases. These rates are generally applied at each stage of production, versus a U.S. sales tax which is levied at the final sale. Many economists argue that VATs aren’t taxes on imports, so they aren’t the equivalent of tariffs. In the case of the EU, taking the VAT into account implies a larger effective tariff rate of roughly 25%.
U.S. trade barriers are uneven with most economies

Sources: Capital Group, PWC, U.S. Census Bureau, World Trade Organization (WTO). Average tariff rates reflect average Most Favored Nation applied rate based on 2023 figures from the WTO, except where noted below. Canada, Mexico and South Korea have free trade agreements with the U.S. and are excluded from this list. China’s average tariff rate on U.S. goods does not include retaliatory tariffs. VAT refers to value-added tax. 1Consumption tax. 2Goods and Service Tax. Bars that extend to the right in the “tariff gap” column indicate tariff gaps that are more preferential to the U.S.; bars that extend to the left indicate the opposite. Only China’s tariff gap favoured the U.S. As of March 10, 2025.
Given the one-on-one nature of these trade negotiations, details matter. Tariffs on major trading partners such as China, the EU, Canada and Mexico can reduce U.S. trade deficits and boost domestic production by giving local firms an edge over imports.
They could also invite retaliation, such as Canada’s 25% tariff on C$30 billion worth of U.S. imported goods rising to C$155 billion if existing U.S. tariffs are maintained. Ontario Premier Doug Ford also temporarily imposed a 25% surcharge on U.S.-bound electricity, while all Canadian provinces and territories have removed U.S. liquor from store shelves. China could ban critical mineral exports to the U.S., decrease purchases of airplanes and agriculture products, and increase investigations of U.S.-based companies with exposure to China, including Apple, Starbucks and Tesla.
5. What impact did tariffs have during the first Trump administration?
Investors may be experiencing a strong sense of déjà vu as tariffs make headlines. The first Trump administration pursued a similar goal of reducing the trade deficit by imposing tariffs on China. That move sparked a trade war that whipsawed markets and dominated the news, much like now.
Tariffs dominated headlines during Trump’s first term

Sources: Capital Group, Bureau of Labor Statistics, Peterson Institute for International Economics, Standard & Poor's. Value of a hypothetical investment in the S&P 500 reflects the total return of the index over the period from January 1, 2018, to December 31, 2019. Past results are not predictive of future performance. The index is unmanaged and, therefore, has no expenses. Investors cannot invest directly in an index. Returns are in USD.
In hindsight, the impact on inflation in the U.S. was muted in the aggregate, with the annual Consumer Price Index ranging from 1.50% to 2.85% in 2018 and 2019. The S&P 500 Index declined in 2018 but rallied sharply in 2019, both years driven by factors other than tariffs.
The world has changed since that initial round of tariffs. The impacts of the pandemic, wars in Ukraine and the Middle East, and the greatest inflation shock in decades continue to ripple through the economy. How tariffs and federal spending cuts will affect growth is even more uncertain given the evolving nature of Trump’s policies.
The lesson may be that in times like these, it’s important to be clear about what we do and don’t know — recognizing that tariffs are just one part of the equation. Focusing on investment principles such as diversification and staying invested in the face of market volatility become more essential to achieving long-term investment goals.
The Consumer Price Index (CPI) is a measure of the average change over time in the prices paid by urban consumers for a market basket of consumer goods and services.
The S&P 500 Index is a market capitalization-weighted index based on the results of approximately 500 widely held common stocks.
Our latest insights
Commissions, trailing commissions, management fees and expenses all may be associated with investments in investment funds. Please read the prospectus before investing. Investment funds are not guaranteed or covered by the Canada Deposit Insurance Corporation or by any other government deposit insurer. For investment funds other than money market funds, their values change frequently. For money market funds, there can be no assurances that the fund will be able to maintain its net asset value per security at a constant amount or that the full amount of your investment in the fund will be returned to you. Past performance may not be repeated.
Unless otherwise indicated, the investment professionals featured do not manage Capital Group‘s Canadian investment funds.
References to particular companies or securities, if any, are included for informational or illustrative purposes only and should not be considered as an endorsement by Capital Group. Views expressed regarding a particular company, security, industry or market sector should not be considered an indication of trading intent of any investment funds or current holdings of any investment funds. These views should not be considered as investment advice nor should they be considered a recommendation to buy or sell.
Statements attributed to an individual represent the opinions of that individual as of the date published and do not necessarily reflect the opinions of Capital Group or its affiliates. This information is intended to highlight issues and not be comprehensive or to provide advice. For informational purposes only; not intended to provide tax, legal or financial advice. Capital Group funds are available in Canada through registered dealers. For more information, please consult your financial and tax advisors for your individual situation.
Forward-looking statements are not guarantees of future performance, and actual events and results could differ materially from those expressed or implied in any forward-looking statements made herein. We encourage you to consider these and other factors carefully before making any investment decisions and we urge you to avoid placing undue reliance on forward-looking statements.
The S&P 500 Composite Index (“Index”) is a product of S&P Dow Jones Indices LLC and/or its affiliates and has been licensed for use by Capital Group. Copyright © 2025 S&P Dow Jones Indices LLC, a division of S&P Global, and/or its affiliates. All rights reserved. Redistribution or reproduction in whole or in part are prohibited without written permission of S&P Dow Jones Indices LLC.
FTSE source: London Stock Exchange Group plc and its group undertakings (collectively, the "LSE Group"). © LSE Group 2025. FTSE Russell is a trading name of certain of the LSE Group companies. "FTSE®" is a trade mark of the relevant LSE Group companies and is used by any other LSE Group company under licence. All rights in the FTSE Russell indices or data vest in the relevant LSE Group company which owns the index or the data. Neither LSE Group nor its licensors accept any liability for any errors or omissions in the indices or data and no party may rely on any indices or data contained in this communication. No further distribution of data from the LSE Group is permitted without the relevant LSE Group company's express written consent. The LSE Group does not promote, sponsor or endorse the content of this communication. The index is unmanaged and cannot be invested in directly.
BLOOMBERG® is a trademark and service mark of Bloomberg Finance L.P. and its affiliates (collectively “Bloomberg”). Bloomberg or Bloomberg’s licensors own all proprietary rights in the Bloomberg Indices. Neither Bloomberg nor Bloomberg’s licensors approves or endorses this material, or guarantees the accuracy or completeness of any information herein, or makes any warranty, express or implied, as to the results to be obtained therefrom and, to the maximum extent allowed by law, neither shall have any liability or responsibility for injury or damages arising in connection therewith.
MSCI does not approve, review or produce reports published on this site, makes no express or implied warranties or representations and is not liable whatsoever for any data represented. You may not redistribute MSCI data or use it as a basis for other indices or investment products.
Capital believes the software and information from FactSet to be reliable. However, Capital cannot be responsible for inaccuracies, incomplete information or updating of the information furnished by FactSet. The information provided in this report is meant to give you an approximate account of the fund/manager's characteristics for the specified date. This information is not indicative of future Capital investment decisions and is not used as part of our investment decision-making process.
Indices are unmanaged and cannot be invested in directly. Returns represent past performance, are not a guarantee of future performance, and are not indicative of any specific investment.
All Capital Group trademarks are owned by The Capital Group Companies, Inc. or an affiliated company in Canada, the U.S. and other countries. All other company names mentioned are the property of their respective companies.
Capital Group funds are offered in Canada by Capital International Asset Management (Canada), Inc., part of Capital Group, a global investment management firm originating in Los Angeles, California in 1931. Capital Group manages equity assets through three investment groups. These groups make investment and proxy voting decisions independently. Fixed income investment professionals provide fixed income research and investment management across the Capital organization; however, for securities with equity characteristics, they act solely on behalf of one of the three equity investment groups.
The Capital Group funds offered on this website are available only to Canadian residents.