Artificial Intelligence
 Chris Buchbinder
Investor enthusiasm for artificial intelligence has gripped the financial markets and shows no signs of loosening its hold.
Semiconductor giant NVIDIA, the leading maker of AI chips, has seen its U.S. stock soar 150% in the first half of the year, boosting the company’s market value to US$3 trillion and briefly making it the largest company in the world. Tech giants Microsoft, Amazon and Broadcom, among the most visible participants in the AI build-out, have also seen their shares rally.
With its potential to turbocharge productivity across the economy, generative AI clearly is a critical concept for us all to understand, not only from the perspective of how we live our lives and operate our businesses but also from an investing perspective.
As much as I believe in AI’s long-term potential, I’ve learned to be skeptical when stocks run this far, this fast. I was an analyst covering telecom companies in the late 1990s during the tech and telecom boom. I remember seeing the tremendous excitement over the internet’s potential to transform the economy. Unfortunately, there was a disconnect between that immediate investor enthusiasm and the real economic benefits that ensued years later.
This was an important lesson for me. The internet has since had a major impact on economic activity, but the returns didn't show up right away — and investors became impatient.
Here are four risks I am thinking about as I consider AI-related investments in my portfolios.
1. Investors often overestimate technology’s near-term impact
We tend to overestimate the impact that technological innovation will have in the near term but underestimate its impact over the longer term. This can be explained by the productivity J curve. When technology is introduced, companies and investors become excited by its transformative potential and invest heavily in building out infrastructure.
Productivity gains from new technologies often take years to surface
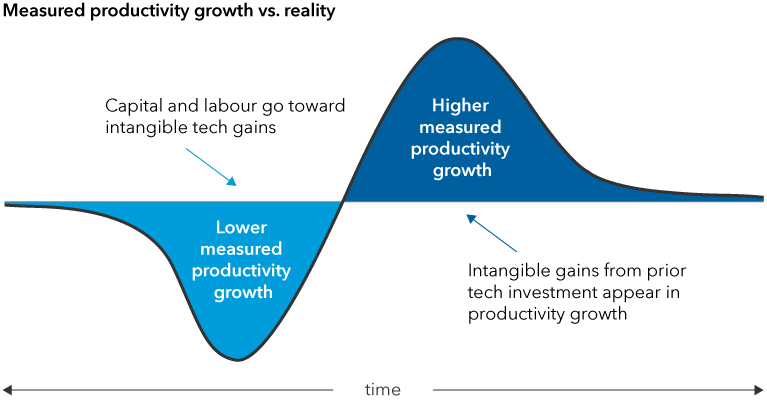
Sources: Capital Group, MIT Initiative on the Digital Economy. The productivity “J curve” illustration shows the lag effect that the introduction of new technology can have on total factor productivity (TFP). TFP is measured as the change in aggregate economic output that is not associated with changes in either capital or labor input and approximates the impact of technology change.
But adapting to new tools for productivity gains takes time. New technology can be a drag on productivity as enterprises and individuals continue with old processes while learning and integrating new ones. As a result, it can be several years before tangible economic benefits are realized.
I believe 10 years from now AI will have transformed the way we do business. But that doesn’t mean that returns will show up immediately or that AI is a one-way escalator up for companies. It is also a cycle, and it will be subject to the same psychology and laws of economics that we've seen in other innovation cycles.
2. The pace of capital investment will depend on results
Tech giants Microsoft, Meta, Alphabet and Amazon have invested tens of billions of dollars in AI infrastructure. Much of this has been spent on semiconductors and other materials needed for the build-out of data centres. For these so-called hyperscalers (companies that represent the leading providers of internet and cloud platforms) to continue spending at such elevated levels, I expect they will need to see a tangible return on their investment in the form of revenue and, ultimately, profit growth.
Tech giants are investing heavily in AI and other capital projects

Sources: Capital Group, FactSet, Standard & Poor’s. “Big Tech’s proportion of total capex” represents total capital expenditures by Alphabet, Amazon, Meta and Microsoft as a percentage of total capital expenditures by companies in the S&P 500 Index. Data as of June 30, 2024.
Will we see returns from AI unfolding over the next year or two? I expect that for some companies we will but for many others we won't. It seems likely that there will be hiccups along the way for companies whose stock prices are already reflecting future AI-related growth expectations.
I've seen this movie before. The market and companies become very enthusiastic about a growth opportunity and invest significantly toward that opportunity. In this case that means spending heavily on AI-related infrastructure. When the market changes its mind and decides spending is a bad thing, the companies will eventually line up and begin to cut spending. That is not the mindset that you see right now with AI-related investments, but when the market changes its mind, you will eventually see that mindset permeate the industry and spending will come down.
The market did in fact punish some leading growth companies in 2022 that were spending aggressively because the return on investment wasn’t there. Meta, the parent of Facebook, notably responded by declaring 2023 a year of efficiency, and it took aggressive steps to cut spending. Today I think that spirit of efficiency still exists across big tech. I expect that these companies will be more disciplined on investments and profit orientation than they have in the past, and that they will eventually show discipline with respect to AI-related spending. If so, this could result in flattening capex but profit and margin surprises over the next several years.
3. Resource constraints could further slow the AI rollout
Building out AI infrastructure requires many resources, not least human talent. This includes not only people who can build the foundational models on which generative AI depends, but those who know how to deploy them at enterprises. AI also requires a great deal of electricity to operate its data centres.
As a result, demand for energy is soaring — pressuring the grid. Hyperscalers have turned to nuclear energy providers to help meet their enormous power needs. In March, Amazon purchased a data centre from Talen Energy to access nuclear power from a nearby Talen plant in the state of Pennsylvania. Last June, Microsoft struck a deal with Constellation Energy to supply one of its data centres in Virginia with nuclear power.
Potential capacity constraints suggest that AI data centres may not be able to grow as quickly as some expect over the next several years.
4. Bubbles can inflict a lot of pain
Has AI entered bubble territory? I don’t know, but we are getting increasingly close to one. As I mentioned earlier, my experience as a telecom analyst in the late 1990s gave me a front row seat for the expansion and bursting of the tech and telecom bubble, so I know how painful the downsides of these market cycles can be. I also know that the cycles tend to occur even if much of the long-term promise ends up being realized, whether with respect to the internet in the 1990s and 2000s or AI today.
Unlike the 1990s tech bubble, recent tech stock gains have been supported by earnings growth

Sources: Capital Group, FactSet, Standard & Poor's. The S&P 500 Information Technology comprises those companies included in the S&P 500 that are classified as members of the GICS® information technology sector. Forward P/E represents the ratio between stock prices and the forward 12-month consensus earnings per share estimate. The two years prior to the dot-com bubble represents the 24 months ended February 29, 2000. The last two years is the 24 months ended June 30, 2024.
To be clear, the excitement over AI stocks is different than the 1990s bubble. For starters, NVIDIA and other tech giants have recorded strong earnings growth in recent quarters and have more valuation support than the leading stocks had in 2000. But I do expect we will reach a zone of disillusionment at some point over the next 12 to 24 months where growth stalls. Despite what has been a strong persistent trend, some leading AI stocks stand the chance of sustaining steep pullbacks. What’s more, it’s not always clear at the start of a major innovation cycle which companies will emerge as long-term winners, so it is important that investors be mindful of the risks.
Even if AI meets the most optimistic expectations of its potential, investors can lose a fair amount of money along the way. When the 2000 tech and telecom bubble burst, many companies went out of business; others sustained steep declines in market value. It took years for some to recover. Back in the late 1990s, Cisco Systems, the maker of networking hardware and telecom equipment for the internet, saw its shares soar, making it the most valuable company in the S&P 500. After the bubble burst, shares plummeted nearly 80% as telecom companies cut spending. The company has yet to recover to its highs of that period.
The bottom line
Today we're in a period of heightened enthusiasm for AI, and I don't question that enthusiasm. I think AI will be spectacular and very important. But I believe that at this point in the cycle investors should be selective and carefully consider the risks.
Chris Buchbinder is a portfolio manager for Capital Group U.S. Equity FundTM (Canada).
The S&P 500 Index is a market capitalization-weighted index based on the results of approximately 500 widely held common stocks.
Our latest insights
-
-
Currencies
-
Market Volatility
-
Market Volatility
-
Markets & Economy
RELATED INSIGHTS
Commissions, trailing commissions, management fees and expenses all may be associated with investments in investment funds. Please read the prospectus before investing. Investment funds are not guaranteed or covered by the Canada Deposit Insurance Corporation or by any other government deposit insurer. For investment funds other than money market funds, their values change frequently. For money market funds, there can be no assurances that the fund will be able to maintain its net asset value per security at a constant amount or that the full amount of your investment in the fund will be returned to you. Past performance may not be repeated.
Unless otherwise indicated, the investment professionals featured do not manage Capital Group‘s Canadian investment funds.
References to particular companies or securities, if any, are included for informational or illustrative purposes only and should not be considered as an endorsement by Capital Group. Views expressed regarding a particular company, security, industry or market sector should not be considered an indication of trading intent of any investment funds or current holdings of any investment funds. These views should not be considered as investment advice nor should they be considered a recommendation to buy or sell.
Statements attributed to an individual represent the opinions of that individual as of the date published and do not necessarily reflect the opinions of Capital Group or its affiliates. This information is intended to highlight issues and not be comprehensive or to provide advice. For informational purposes only; not intended to provide tax, legal or financial advice. Capital Group funds are available in Canada through registered dealers. For more information, please consult your financial and tax advisors for your individual situation.
Forward-looking statements are not guarantees of future performance, and actual events and results could differ materially from those expressed or implied in any forward-looking statements made herein. We encourage you to consider these and other factors carefully before making any investment decisions and we urge you to avoid placing undue reliance on forward-looking statements.
The S&P 500 Composite Index (“Index”) is a product of S&P Dow Jones Indices LLC and/or its affiliates and has been licensed for use by Capital Group. Copyright © 2025 S&P Dow Jones Indices LLC, a division of S&P Global, and/or its affiliates. All rights reserved. Redistribution or reproduction in whole or in part are prohibited without written permission of S&P Dow Jones Indices LLC.
FTSE source: London Stock Exchange Group plc and its group undertakings (collectively, the "LSE Group"). © LSE Group 2025. FTSE Russell is a trading name of certain of the LSE Group companies. "FTSE®" is a trade mark of the relevant LSE Group companies and is used by any other LSE Group company under licence. All rights in the FTSE Russell indices or data vest in the relevant LSE Group company which owns the index or the data. Neither LSE Group nor its licensors accept any liability for any errors or omissions in the indices or data and no party may rely on any indices or data contained in this communication. No further distribution of data from the LSE Group is permitted without the relevant LSE Group company's express written consent. The LSE Group does not promote, sponsor or endorse the content of this communication. The index is unmanaged and cannot be invested in directly.
BLOOMBERG® is a trademark and service mark of Bloomberg Finance L.P. and its affiliates (collectively “Bloomberg”). Bloomberg or Bloomberg’s licensors own all proprietary rights in the Bloomberg Indices. Neither Bloomberg nor Bloomberg’s licensors approves or endorses this material, or guarantees the accuracy or completeness of any information herein, or makes any warranty, express or implied, as to the results to be obtained therefrom and, to the maximum extent allowed by law, neither shall have any liability or responsibility for injury or damages arising in connection therewith.
The MSCI information may only be used for your internal use, may not be reproduced or redisseminated in any form and may not be used as a basis for or a component of any financial instruments or products or indices. None of the MSCI information is intended to constitute investment advice or a recommendation to make (or refrain from making) any kind of investment decision and may not be relied on as such. Historical data and analysis should not be taken as an indication or guarantee of any future performance analysis, forecast or prediction. The MSCI information is provided on an “as is” basis and the user of this information assumes the entire risk of any use made of this information. MSCI, each of its affiliates and each other person involved in or related to compiling, computing or creating any MSCI information (collectively, the “MSCI Parties”) expressly disclaims all warranties (including, without limitation, any warranties of originality, accuracy, completeness, timeliness, non-infringement, merchantability and fitness for a particular purpose) with respect to this information. Without limiting any of the foregoing, in no event shall any MSCI Party have any liability for any direct, indirect, special, incidental, punitive, consequential (including, without limitation, lost profits) or any other damages. (www.msci.com)
Capital believes the software and information from FactSet to be reliable. However, Capital cannot be responsible for inaccuracies, incomplete information or updating of the information furnished by FactSet. The information provided in this report is meant to give you an approximate account of the fund/manager's characteristics for the specified date. This information is not indicative of future Capital investment decisions and is not used as part of our investment decision-making process.
Indices are unmanaged and cannot be invested in directly. Returns represent past performance, are not a guarantee of future performance, and are not indicative of any specific investment.
All Capital Group trademarks are owned by The Capital Group Companies, Inc. or an affiliated company in Canada, the U.S. and other countries. All other company names mentioned are the property of their respective companies.
Capital Group funds are offered in Canada by Capital International Asset Management (Canada), Inc., part of Capital Group, a global investment management firm originating in Los Angeles, California in 1931. Capital Group manages equity assets through three investment groups. These groups make investment and proxy voting decisions independently. Fixed income investment professionals provide fixed income research and investment management across the Capital organization; however, for securities with equity characteristics, they act solely on behalf of one of the three equity investment groups.
The Capital Group funds offered on this website are available only to Canadian residents.