Fixed Income
- The price of long-duration credit doesn’t necessarily decline substantially following a rise in short-term rates.
- When weighing the merits of delaying liability-driven investing (LDI) implementation, use forward curves to compare the return potential of different bond portfolios in light of expected changes in interest rates.
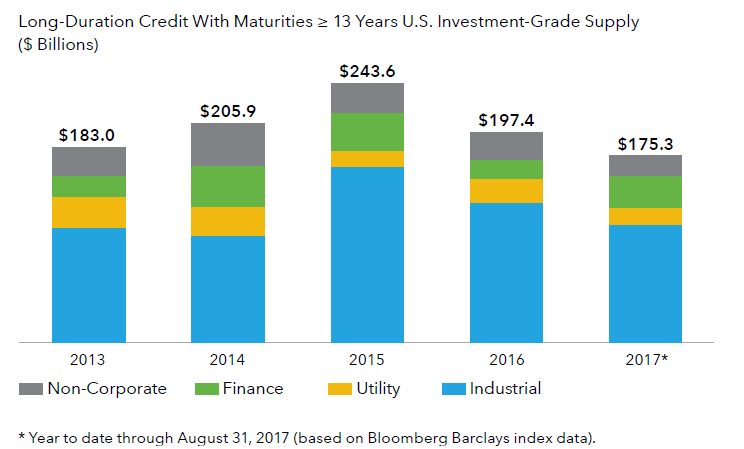
- Widespread acceptance of LDI and increased longevity suggests that — in the near future — supply may not fully meet growing demand for long-duration bonds.
- Issuance of corporate bonds with longer maturities could diminish as rates rise — resulting in reduced supply at a time of increased demand. Arguably, LDI implementation may become more challenging in the not-too-distant future.
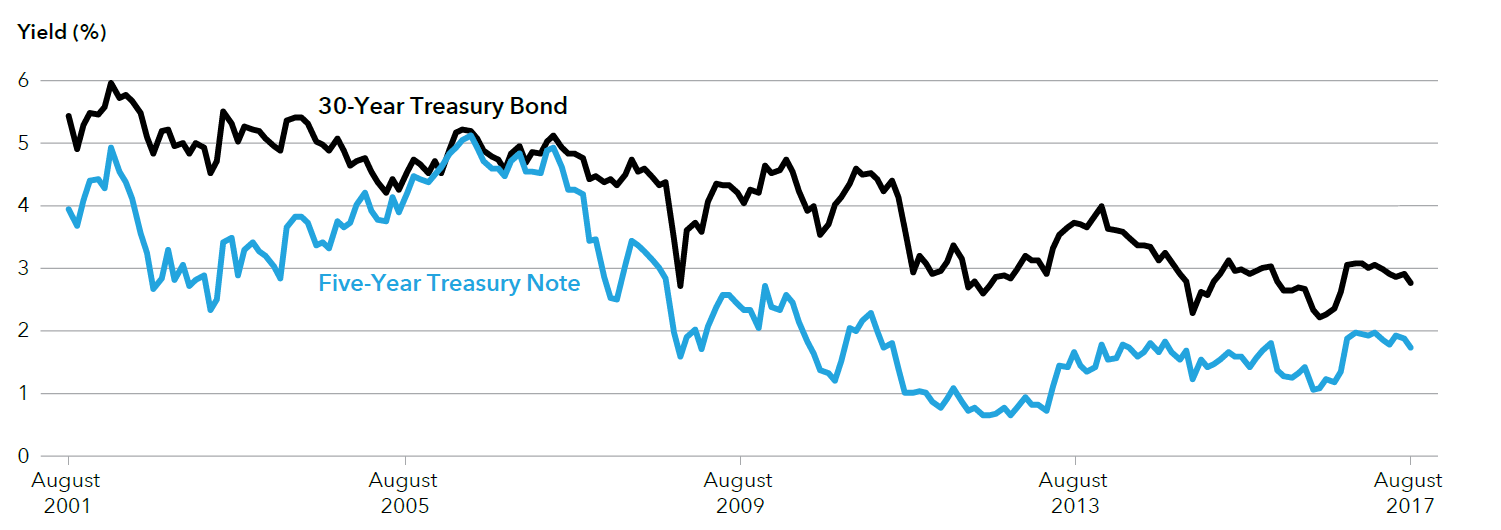
Bond yields remain well below recent highs, causing some plan sponsors to hold off on LDI

Source: Bloomberg Index Services Ltd. Month-end yields from August 31, 2001, through August 31, 2017.
Focus on the federal funds target, miss the bigger picture?
With one eye on the Federal Reserve’s steady progress raising the federal funds target rate, many plan sponsors have hit the LDI pause button. Yields are set to rise, the argument goes, so why not wait until the Fed is further into its rate hike cycle and bonds are less expensive?
The question is a perfectly sensible one, but it does rest on an assumption that bears further investigation. In particular, plan sponsors that are adopting a wait-and-see approach to LDI may be under the impression that a higher Fed funds target rate necessarily results in equally higher longer term yields.
History, however, shows that this outcome is not always the case, and that the relationship between short- and long-term rates varies. The shape of the yield curve can change quite dramatically, alternating between extended periods of flattening (when the gap between shorter and longer term yields narrows) and steepening (when the gap widens), punctuated with sharp short-term moves.
With that in mind, we believe that plan sponsors who have questions about the timing of implementing LDI should look beyond the absolute level of the Fed funds rate. For instance, it’s possible that in the future, LDI implementation may be more costly and difficult if, as expected, long-duration credit grows scarce (more on that later). And, even if short-term rates rise, a long-duration strategy could still fare relatively well in that kind of scenario — depending on how the yield curve’s shape changes.
To arrive at a better-informed assessment of the relative attractiveness of a long duration strategy, we suggest that plan sponsors consider interest rate forward curves. In essence, these curves show how the yield curve could look at specified points in the future, based on current market pricing. They are not, therefore, necessarily a forecast.
However, used in combination with appropriate bond market indexes (serving as proxies for a broadly diversified bond portfolio and a portfolio focused on long-duration bonds), forward curves can help plan sponsors estimate possible changes in the value of different portfolios.
Consider a hypothetical example where a sponsor is considering whether to maintain its current intermediate bond portfolio and delay reallocating into a long-duration portfolio until two years in the future, when it expects the Fed to be much further into its rate hike cycle. To help decide between reallocating to long duration now or waiting two years, the sponsor could calculate expected total returns over the next two years — using the Barclays U.S. Aggregate Index and Barclays Long Government/Credit Index as proxies for the current portfolio and a long-duration portfolio.
Forward curves show the interest rates that current market pricing suggests are likely in the future

Source: Bloomberg Index Services Ltd.
The projected impact of expected interest rate movements on each portfolio over the next two years can then be estimated in a few simple steps:
- Note the current yield on each index. As of August 31, 2017, the yields on the Bloomberg Barclays U.S. Aggregate Index and Bloomberg Barclays Long Government/Credit Index were 2.37% and 3.51%, respectively.
- For each index, identify the appropriate interest rate to use for calculation of accumulated yield and total return. An interpolated six-year Treasury note has a comparable duration (about six years) to the Bloomberg Barclays U.S. Aggregate Index; an interpolated 25-year Treasury bond (duration of about 15 years) is an appropriate choice for the Bloomberg Barclays Long Government/Credit Index.
- Calculate the projected cumulative impact of expected interest rate moves indicated by forward curves. Use simple bond math to iteratively calculate accumulated yield, capital loss and expected total return using the appropriate points on the forward curves (six years and 25 years, in this example) to represent future interest rate moves.
In this way, sponsors can use forward rates and market indexes to gain an informed perspective on how the value of a long-duration portfolio may change compared to another diversified bond portfolio. Of course, this viewpoint is in no way a prediction. Forward curves can only ever offer an indication of current expectations about future rates.
Still, this type of analysis can be an eye-opener and may lead to some surprising conclusions. As our hypothetical example illustrates, it’s quite possible for a portfolio whose duration is matched to the Barclays Long Duration Government/Credit Index to outperform a portfolio benchmarked to the Barclays U.S. Aggregate Index in a rising rate/flattening yield curve environment.
The LDI waiting game may be a difficult one to win
In recent years, U.S. public companies have recorded fairly stable funded statuses. Research from actuarial and consulting firm Milliman found that the 100 largest defined benefit plans have had a percentage funded status in the low 80s for the last few years.
That said, a number of sponsors and their plans that have implemented LDI have also fared relatively well lately. The authors of the Milliman 2017 Corporate Pension Funding Study noted: “Generally, plans with greater allocations to fixed income earned slightly higher returns ... . Long duration corporate bonds almost matched the returns on U.S. equities, with both of these assets contributing to double-digit returns in 2016.”
Forward curves suggest that potential total returns for a long duration bond portfolio appear relatively attractive

Source: Bloomberg Index Services Ltd. and Capital Group. Simplified analysis assumes: credit spreads are static; cash flows are reinvested at original yield; no duration drift; no compounding; no convexity effects. Accumulated yield calculated by taking starting yield for the first year and adding or subtracting yield due to yield curve steepening/flattening for the second year. For illustrative purposes only and in no way represents the result of an actual investment. The market indexes are unmanaged and, therefore, have no expenses. Investors cannot invest directly in an index.
If interest rates do move even higher, three key criteria used in LDI glide path allocation — interest rates, funded status and relative value of equities/other asset classes — could to varying degrees make the case for increased allocation to long-duration bonds.
Currently, the new-issue market for long credit is healthy, and adequate supply continues to be met with strong demand. Pricing appears rational and the secondary-market liquidity — though lower than it once was — enables sponsors to construct an appropriate long-duration portfolio within a reasonable period.
Unfortunately, there’s good reason to believe that it may become increasingly difficult to implement LDI over the next few years. Specifically, our research suggests that plan sponsors seeking to initiate or expand a long-duration strategy may be confronted by a market supply-demand mismatch that makes it challenging to construct a diversified portfolio. Higher rates could slow down bond supply — especially for credit with longer maturities. If the pace of supply were to slacken as sponsors seek to increase their plans’ allocations to long duration corporates, it could result in significant difficulties for sponsors. Some plans may be unable to execute their bond purchases fully (or efficiently) amid prevailing price distortions and higher implementation costs.

Faced with this potentially challenging outlook, we think it’s crucial for corporate sponsors to revisit the question of whether delaying LDI implementation makes sense. Depending on the particular circumstances of a corporate sponsor and their plan, there are a variety of potentially attractive approaches to LDI that an active credit manager could develop using both cash bonds and derivatives.
Bloomberg® is a trademark of Bloomberg Finance L.P. (collectively with its affiliates, “Bloomberg”). Barclays® is a trademark of Barclays Bank Plc (collectively with its affiliates, “Barclays”), used under license. Neither Bloomberg nor Barclays approves or endorses this material, guarantees the accuracy or completeness of any information herein and, to the maximum extent allowed by law, neither shall have any liability or responsibility for injury or damages arising in connection therewith.
Use of this website is intended for U.S. residents only.
 Greg Garrett