Fed
Markets have been on edge lately about when the U.S. Federal Reserve plans to cut rates. With the Fed set to issue an update to its closely watched dot plot in March, it’s good to remember that historical projections can be poor predictors, especially when the Fed is determined to remain ‘data-dependent,’ and market events remain fluid.
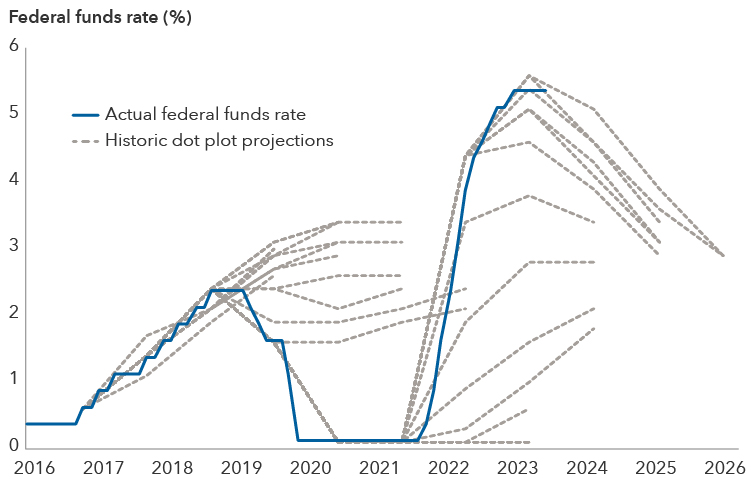
The Fed’s dot plot projections have historically missed the mark

Sources: Capital Group, Bloomberg. As of February 23, 2024. Federal funds rate data from January 2016 to February 2024. Forward looking dot plot projections are reported quarterly from September 2016 through December 2023.
The Fed is clear that the rate projections in its quarterly ‘dot plot’ are not intended to outline future policy. And, as the chart above shows, the Fed ‘dots’ have historically been an inaccurate indicator of where the federal funds rate has ultimately gone.
However, these numbers still remain under investors’ microscope as they try to figure out what’s next. In December, for example, rates fell dramatically when the Fed updated its dot plot to show 75 basis points of rate cuts for 2024, although some of that enthusiasm has been tempered by a stronger-than-anticipated inflation reading in recent weeks.
"This cycle has proved very difficult to predict, and the economy has shown more resilience against monetary policy tightening than many expected,” said Doug Kletter, a Capital Group fixed income analyst and member of the U.S. interest rates team. "However, this does not mean policy is ineffective. We are still learning how fiscal policy, shrinking usage of the Fed’s reverse repo facility and monetary lags are impacting the economy. The takeaway for me is that the path of monetary policy will remain data dependent, and investors should remain open-minded about future paths for rates."
Federal funds rate – The target rate reflects the upper bound of the Federal Open Markets Committee’s target range for overnight lending among U.S. banks.
Reverse repo facility - The New York Fed conducts repurchase (repo) and reverse repurchase operations each day as a means to help keep the federal funds rate in the target range set by the Federal Open Market Committee (FOMC).
Monetary lag - Policy lag time between the identification of an economic activity and the attainment of an effect on the economy.
Inflation – The rise in the prices of goods and services as happens when spending increases relative to the supply of goods on the market – in other words, too much money chasing too few goods. Core inflation metrics strip out volatile items like food and energy.
 Doug Kletter