Chart in Focus
Municipal Bonds
- The rally in high-yield municipal bonds has been a bright spot in fixed income
- Valuations are stretched, though yields still compare favorably with other bond markets
- Current pricing in this underresearched market underscores the need for selective investing
- With their historically low correlation to equities, high-yield municipals can occupy a sweet spot in portfolio construction
High-yield municipal bonds have been on a tear. For many investors seeking higher income and total returns, this area of the bond market has been the place to be in fixed income. As of July 31, the Bloomberg Barclays High Yield Municipal Bond Index had notched a year-to-date return of 7.4% — well above the gains recorded in most other parts of the U.S. bond market.
Following an extended rally, however, spreads have narrowed to pre-pandemic levels. Municipal fundamentals have experienced a remarkable turnaround due to the more than $1 trillion of pandemic-era fiscal stimulus. The recent increase in rating upgrades should continue as local economies recover. At the same time, investor demand has remained robust. Year-to-date muni fund inflows through July 31 totaled $57 billion — nearly 50% higher than the net inflows for all of 2020.
Amid stretched valuations, now seems like a good time for investors to reassess high-yield municipal bonds. With that in mind, here’s our take on this underresearched and underinvested asset class.
Income remains relatively attractive
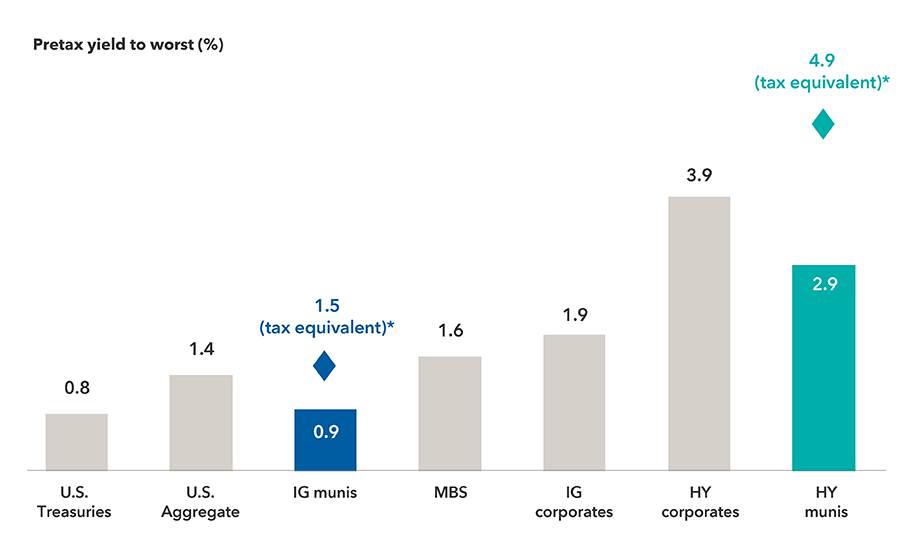
From an income perspective, high-yield municipal bonds offer attractive carry (put simply, yield earned by holding the bond to maturity, minus the cost of short-term financing) relative to other segments of the fixed income market. And, on a taxable-equivalent basis, relative value remains compelling.
High-yield municipals outyield corporates on a taxable-equivalent basis

*Tax-equivalent yields, assuming the top federal marginal tax rate for 2021 of 37%, plus the 3.8% Medicare tax.
Source: Bloomberg Index Services Ltd. Yield to worst as of 7/31/21. Market proxies are the Bloomberg Barclays U.S. Aggregate Index and its components for U.S Treasuries, mortgage-backed securities (MBS) and investment-grade (IG) corporates (rated BBB/Baa and above), and the Bloomberg Barclays Municipal Bond Index (investment-grade munis), Bloomberg Barclays U.S. Corporate High Yield Index (high-yield corporates) and Bloomberg Barclays High Yield Municipal Bond Index (high-yield munis). Yield to worst is the lowest yield that can be realized by either calling or putting on one of the available call/put dates, or holding a bond to maturity. Calling and putting refer to features of some bonds that enable an issuer to redeem the bond early, or a bondholder to demand early repayment from the issuer.
Investors should be prepared for more muted returns
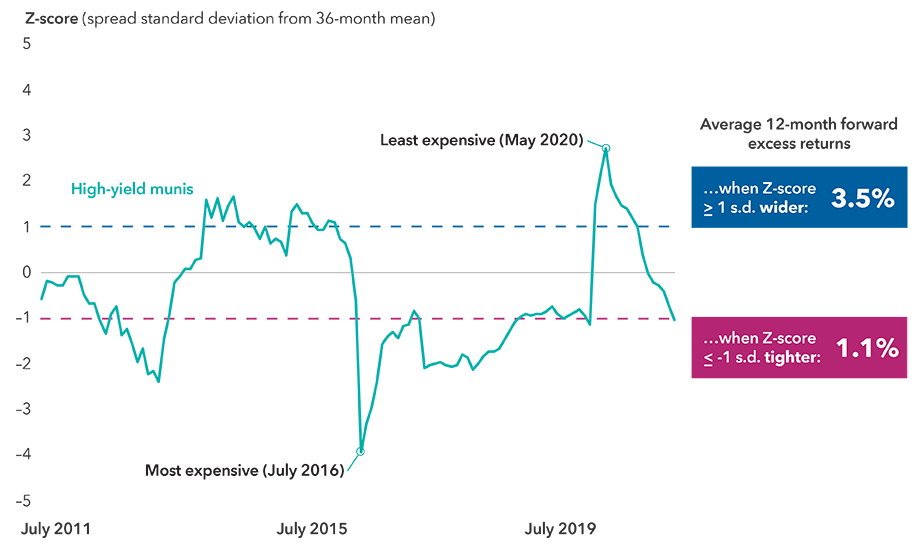
High-yield muni spreads are more than one standard deviation tighter than their 10-year average. Because fundamentals are now on a firmer footing than they were pre-pandemic, there appears to be limited potential for further spread tightening.
When spreads have been this narrow in the past, the ensuing returns generated from tightening have tended to be muted compared to returns in periods when valuations were less expensive. The chart below illustrates this in terms of the Z-score, which shows spread levels relative to the moving average, measured in standard deviations.
Historically, returns have moderated following periods of high valuation

Source: Bloomberg Index Services Ltd. Bloomberg Barclays High Yield Municipal Bond Index month-end spreads for the period July 2011 through June 2021. Standard deviation is a statistical measure of the dispersion of a dataset relative to its mean. In a typical normal distribution (bell curve), about 68% of values in the dataset can be found within one standard deviation of the mean.
In the near to medium term, credit spread changes may be less of a driver of returns — but what about interest rates? In our view, a combination of macro, policy and technical factors make the possibility of rising rates a significant downside risk. Economic recovery and higher inflation expectations are providing conditions that could help lift bond yields. And, given the predominance of retail investors, any abrupt rate increases could prompt outflows from this asset class.
Furthermore, high-yield municipal bonds are often longer in duration (about 5.5 years is typical) compared to their investment-grade counterparts. Active management of duration and curve positioning in this uncertain rates environment is, therefore, especially important.
Selective exposure is prudent given the market’s credit profile
The credit ratings profile of high-yield municipal bonds also argues for taking exposure on a selective basis. Accounting for about 14% of the total municipal bond market, high-yield issues are typically rated below BB or are unrated. There are about 98,000 below-investment-grade and unrated issues outstanding.
The issuer universe is diverse. As might be expected, there are credit-challenged borrowers. However, there are also numerous smaller borrowers with modest capital needs; arguably, many of these issuers could actually warrant an investment-grade rating — if they had been around longer.
Unrated bonds are the largest segment of this market. Crucially, these issues are not necessarily riskier than rated high-yield bonds. Rather, their lack of rating may reflect that an entity has tended to issue less frequently, or perhaps in smaller sizes. Bond-by-bond credit analysis is, therefore, crucial for shining a light on fundamentals in this underresearched corner of the muni market.
Most high-yield municipal bonds are unrated

Source: Bloomberg Index Services Ltd. As of 7/31/21. For simplicity, chart omits small percentages of unrated issues in IG; for HY, those issues rated investment grade or classified as cash and equivalents are omitted.
Sector composition is more concentrated than in the investment-grade universe. The industrial development revenue (IDR), health care and special tax sectors account for the lion’s share of high-yield municipals. Special tax bonds may be less well-known: These issues are repaid with revenues from taxes on specific goods and services, or special assessment taxes levied on property owners. Overall, these sectors are dominated by project finance bonds and land-backed deals.
Three revenue bond sectors account for 62% of high-yield municipal bonds

Source: Bloomberg. As of 6/30/21. IDR refers to the industrial development revenue bond sector.
High-yield municipal bonds can occupy a sweet spot in portfolio construction
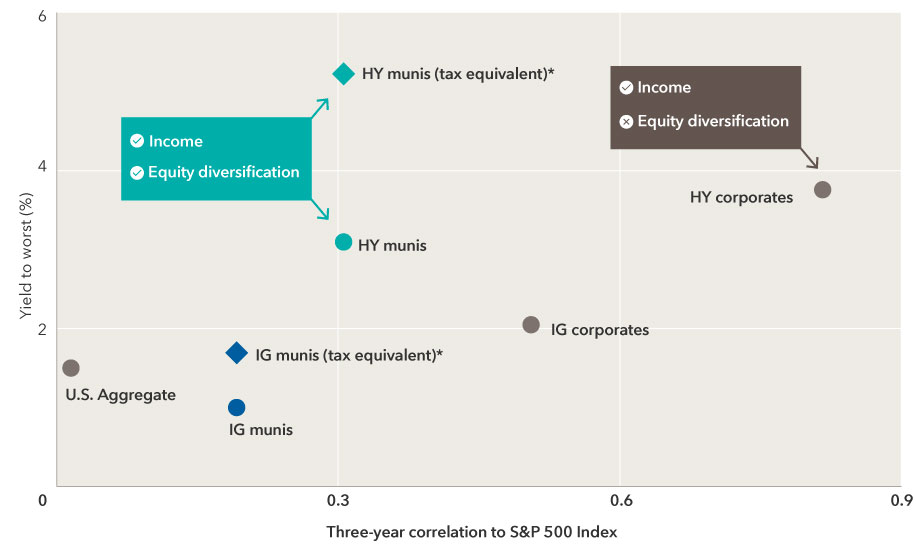
This asset class offers yields at a relatively favorable level (especially for individuals in higher income tax brackets), but without the high correlation to equities that has so often seen high-yield corporates sell off alongside equities. That historical return profile offers food for thought in the current environment, where the stock market has touched new highs and valuations among high-yield corporates appear even more stretched than in munis.
Compared with high-yield corporate bonds, similarly rated municipals recently offered a yield advantage of nearly 150 basis points (taxable equivalent). In addition to that favorable income potential, high-yield munis can offer excellent diversification potential for equity-heavy portfolios. As of June 30, 2021, the Bloomberg Barclays High Yield Municipal Bond Index had a three-year correlation to the S&P 500 Composite Index of just 0.3.
High yield, with a twist: tax-advantaged income and equity diversification

*Tax-equivalent yield, assuming the top federal marginal tax rate for 2021 of 37%, plus the 3.8% Medicare tax.
Source: Bloomberg Index Services Ltd. Yield to worst and correlation as of 6/30/21. Market proxies are Bloomberg Barclays U.S. Aggregate Index, Bloomberg Barclays U.S. Corporate Investment Grade Index, Bloomberg Barclays Municipal Bond Index (IG munis), Bloomberg Barclays U.S. Corporate High Yield Index (HY corporates) and Bloomberg Barclays High Yield Municipal Bond Index (HY munis). Correlation describes how closely changes in the returns of two assets mirror each other. A value of 0.3 or below is often characterized as “low,” and suggests the two assets may have a diversifying effect when held together in a portfolio.
Now’s not the time to stretch for yield
Amid tight spreads and favorable fundamentals, some municipal bond investors may be tempted to take on more risk in exchange for higher yields. We think that reaching for yield in the current environment can leave portfolios vulnerable.
At present, investors aren’t being compensated well for moving significantly lower in credit quality, extending duration, or adding leverage to amplify returns from higher quality bonds. Taking on additional muni risks in these ways may introduce significant volatility into portfolios, especially during an outflow cycle.
One way to try to reduce volatility without sacrificing too much yield could be to moderate exposure to credit risk overall, while seeking spread opportunities among higher rated municipal credits. It may also be sensible to build liquidity now — either in cash or higher quality bonds. That way, when dislocations do arise, investors with a valuation-centric approach may be well-positioned to take advantage of more favorable entry points.
Bond ratings, which typically range from AAA/Aaa (highest) to D (lowest), are assigned by credit rating agencies such as Standard & Poor's, Moody's and/or Fitch, as an indication of an issuer's creditworthiness.
Lower rated bonds are subject to greater fluctuations in value and risk of loss of income and principal than higher rated bonds. Income from municipal bonds may be subject to state or local income taxes and/or the federal alternative minimum tax. Certain other income, as well as capital gain distributions, may be taxable.
Methodology for calculation of tax-equivalent yield:
Based on 2021 federal tax rates. Taxable equivalent rate assumptions are based on a federal marginal tax rate of 37%, the top 2021 rate. In addition, we have applied the 3.8% Medicare tax. Thus taxpayers in the highest tax bracket will face a combined 40.8% marginal tax rate on their investment income. The federal rates do not include an adjustment for the loss of personal exemptions and the phase-out of itemized deductions that are applicable to certain taxable income levels.
Bloomberg Barclays Municipal Bond Index is a market-value-weighted index designed to represent the long-term investment-grade tax-exempt bond market. Bloomberg Barclays U.S. Corporate Investment Grade Index represents the universe of investment grade, publicly issued U.S. corporate and specified foreign debentures and secured notes that meet the specified maturity, liquidity, and quality requirements. Bloomberg Barclays High Yield Municipal Bond Index is a market-value-weighted index composed of municipal bonds rated below BBB/Baa. Bloomberg Barclays U.S. Aggregate Index represents the U.S. investment-grade fixed-rate bond market. Bloomberg Barclays U.S. Corporate High Yield Index covers the universe of fixed-rate non-investment-grade debt. Bloomberg Barclays U.S. Mortgage Backed Securities Index is a market-value-weighted index that covers the mortgage-backed pass-through securities of Ginnie Mae (GNMA), Fannie Mae (FNMA), and Freddie Mac (FHLMC). Bloomberg Barclays U.S. Treasury Index is a market-value-weighted index including U.S. Treasury securities with at least one year to final maturity.
Bloomberg® is a trademark of Bloomberg Finance L.P. (collectively with its affiliates, “Bloomberg”). Barclays® is a trademark of BarclaysBank Plc (collectively with its affiliates, “Barclays”), used under license. Neither Bloomberg nor Barclays approves or endorses this material, guarantees the accuracy or completeness of any information herein and, to the maximum extent allowed by law, neither shall have any liability or responsibility for injury or damages arising in connection therewith.The Bloomberg Barclays indexes are unmanaged, and results include reinvested dividends and/or distributions but do not reflect the effect of sales charges, commissions, account fees, expenses or U.S. federal income taxes.
Standard & Poor’s 500 Composite Index is a market capitalization-weighted index based on the results of approximately 500 widely held common stocks. Standard & Poor’s 500 Composite Index (“Index”) is a product of S&P Dow Jones Indices LLC and/or its affiliates and has been licensed for use by Capital Group. Copyright © 2021 S&P Dow Jones Indices LLC, a division of S&P Global, and/or its affiliates. All rights reserved. Redistribution or reproduction in whole or in part is prohibited without written permission of S&P Dow Jones Indices LLC.
 Greg Ortman