Interest Rates
Fixed Income
High yield is finally deserving of its name again. The high-single-digit yields that the sector is offering are renewing investor interest in this asset class, even as the specter of a recession raises some concerns. We do not believe in timing this market.
History shows that when yields rise to the high-single-digit range, they tend not to stay that elevated for very long, as the discounted price and higher yields tend to draw in a broader cross section of investors. The carry (interest earned) that the high coupon provides also helps mitigate the risk of return volatility.
High-yield investors also benefit from cash flows arising from calls and tenders. This creates an ability to redeploy that cash in opportunities at potentially higher yields.
We discuss here five factors that make the case for investing in high yield and how we are approaching this market in a period of economic uncertainty, as well as when macro factors are having a large influence on markets.
There is no doubt that we are in an uncertain economic environment. We could also be in a recession that is in large part the result of the U.S. Federal Reserve’s aggressive stance on fighting inflation. As expected, the Fed raised interest rates by 75 basis points at its September meeting. But how soft or shallow will the recession be?
If the Fed’s actions are not successful in bringing down inflation, or if they push the economy into a longer, deeper recession, the high-yield market — and credit and risk assets more broadly — could face a bumpy ride.
One could argue that the negative scenario is reflected in prices already, given that returns for most areas of fixed income were in the negative high single digits through the end of August this year. On the other hand, if the Fed manages a “softer landing,” high-yield bonds could rally. Thus, it may make sense for investors to consider building exposure to high yield. We believe several areas of the market could be resilient. In this environment, our focus is on quality: for example, one of our largest high-yield portfolios is invested 34% in bonds rated BB and 40% in bonds rated B.
1. Stronger fundamentals and lower issuance support valuations
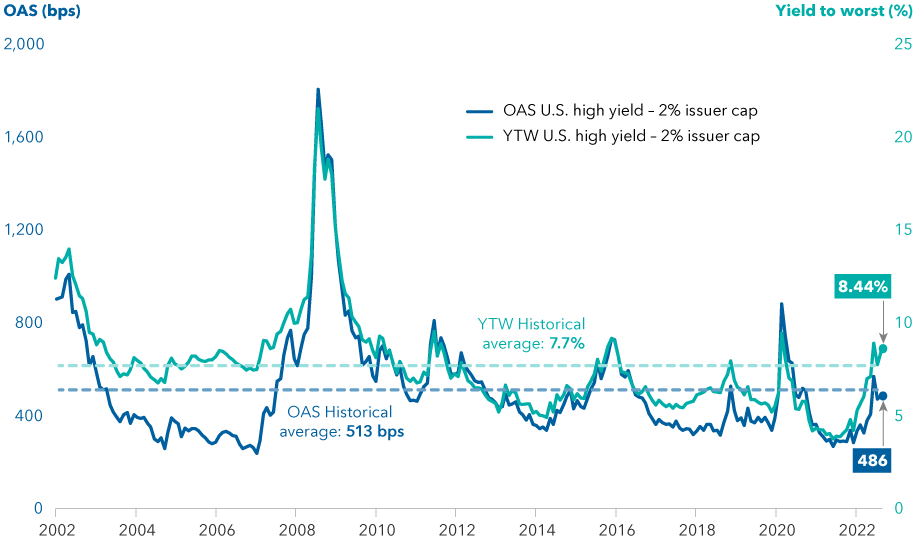
Even with a softer macroeconomic backdrop, the high-yield market appears healthier and more stable than it has been in many years. We have a weaker economic environment but a stronger asset class, and the combination has resulted in yield spreads of around 480 basis points (bps) that are in line with historical averages, bringing the yield to worst on the benchmark Bloomberg U.S. Corporate High Yield 2% Issuer Capped Index to 8.4% as of the end of August.
High-yield spreads and yields are in line with their long-term averages
Source: Bloomberg. OAS = option-adjusted spread; YTW = yield to worst. Data as of August 31, 2022.
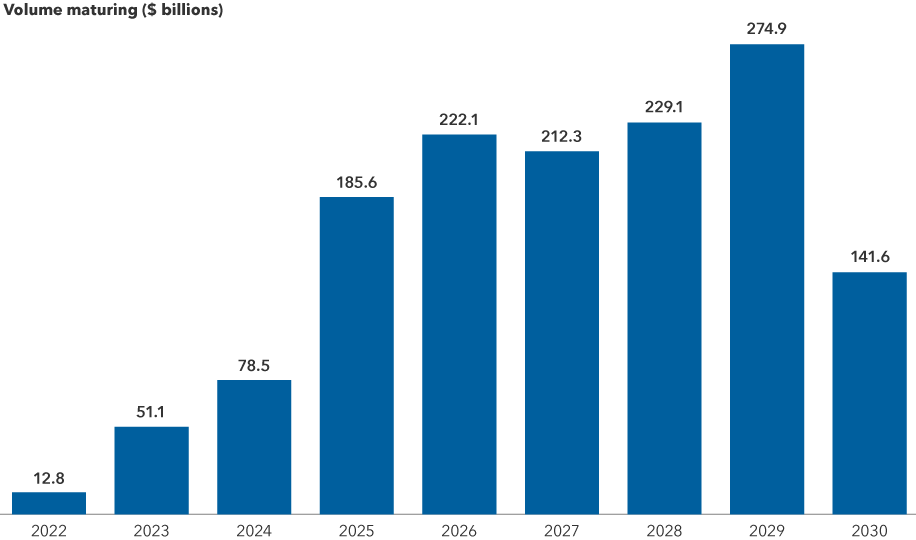
A second positive factor is the absence of near-term large-scale refinancing requirements. Savvy corporate management teams have tapped into the low-rate and favorable credit environment of the past few years to complete their financing requirements. Especially in 2021, companies were able to refinance their near-term debt at exceptionally low yields and push maturities out by several years.
As a result, corporate borrowers have entered this period of rising rates with financing that has been locked in for a few years. Because of that, many can sit on the sidelines today and do not need to issue new debt at prevailing higher rates. Many companies don’t need to tap capital markets or refinance until 2025, so the volume of issuance could remain low for at least another year, unless rates fall or high-yield spreads tighten.
Year to date through August, there has been about $92 billion in high-yield issuance, compared to approximately $366 billion for the same period last year. So, the opportunity set for us has shifted to the secondary market, where we are looking at relative value across capital structures and between issuers in the same industry, or even between industries.
We are concerned about the lower-rated segment of high-yield companies that were waiting for their own prospects to improve before refinancing their debt. These firms may have missed the window to capture the lowest rates. While they represent a small segment of the high-yield market today, they also present us with opportunities to find solid companies seeking fresh capital that will now have to come with higher coupons.
Many borrowers have time to refinance and are sitting on the sidelines
Source: Bloomberg. Data as of June 30, 2022. Illustrates dollar volume of high yield bonds maturing in calendar years 2022 through 2030.
2. Default rates are likely to remain low
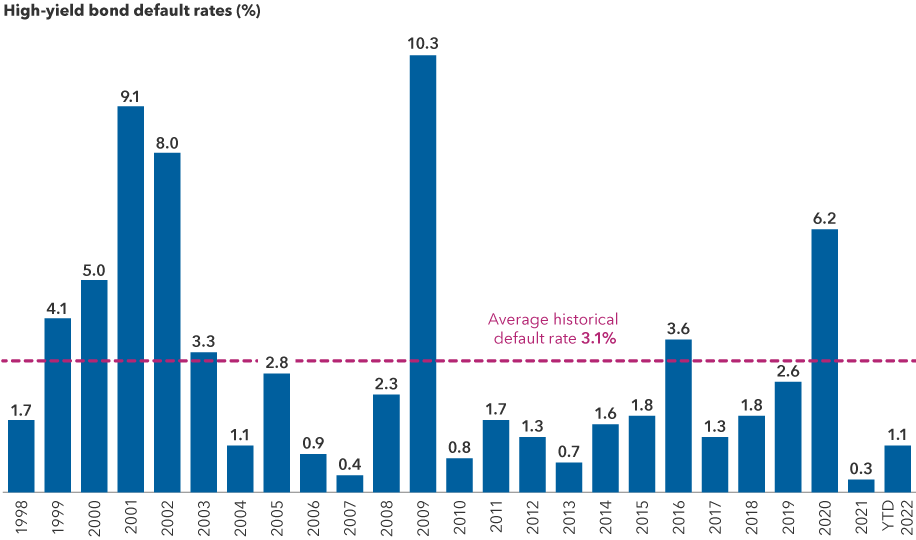
Also supporting the high-yield asset class are solid economic fundamentals, which should keep default rates relatively low. At less than 1%, the latest 12 months’ default rate is very low by historical standards. When we evaluate future default probabilities, we consider the amount of bonds that are trading at distressed levels, because this can be an early indicator of future defaults. Today, distressed debt as a percentage of the high-yield universe is in the mid-single digits. Based on this metric, while we do expect the default rate to rise from very low levels, we are not forecasting a spike in defaults.
Another factor that we consider is the universe of high-yield debt that is rated triple-C or below. This too, is around historical lows at about 12% of the high-yield market, compared to 20% in December 2007, prior to the recession following the global financial crisis. So, when we combine these three parameters — historically low default rates around 1%, triple-C and below-rated securities at about 12% of the market, and distressed debt stock in the mid-single digits as a percentage of the universe — it presents an overall supportive credit picture for the high-yield market.
High-yield default rates are near historic lows
Source: J.P. Morgan. Trailing 12-month results. Data as of July 31, 2022.
3. Risk of contagion from leveraged loan market is limited
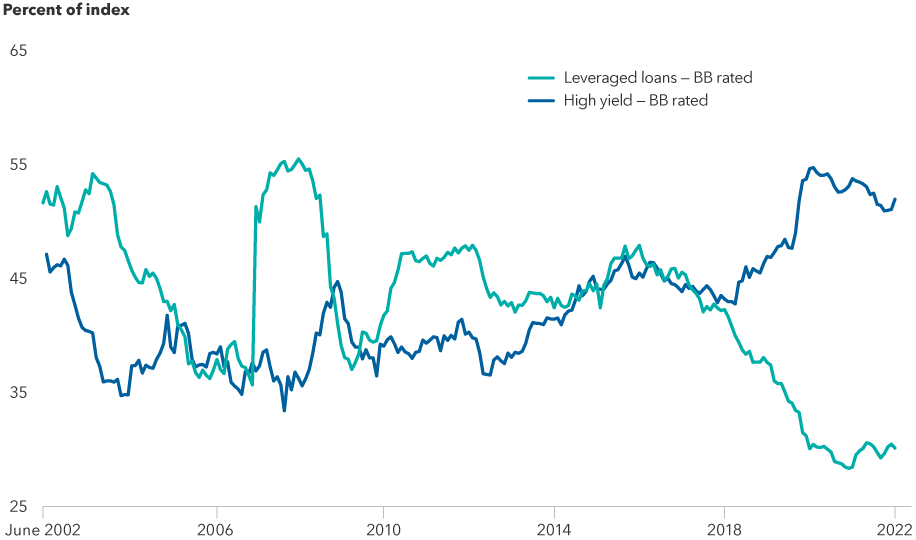
The relationship between the high-yield and leveraged loan markets has evolved over the past decade. Historically, companies might have issued floating-rate loans as part of the secured portion of their capital structure, and separately issued fixed-rate unsecured bonds in the high-yield market. Today, many companies — often backed by private equity — that would have come to the high-yield market to finance themselves, have instead chosen to issue solely in the leveraged loan market. So, a lot of the risk traditionally associated with high-yield bond investing has migrated to the leveraged loan market. (Both the leveraged loan and private credit markets have expanded so rapidly that, today, their size, at about $1.2 trillion, is similar to that of the high-yield market.)
Companies that are tapping both the high-yield and the leveraged loan markets tend to be higher quality, larger firms issuing loans in conjunction with high-yield bonds, rather than to finance their entire capital structures. As a result, the high-yield market now is made up of stronger companies, based on credit ratings, and is also less exposed to private equity portfolio companies (which can be the most aggressively financed issuers in the debt markets).
Companies that are seeking to be upgraded to investment-grade (BBB/Baa and above) can be attractive because they not only present an opportunity to earn a high coupon today, but can also benefit from the price appreciation that often comes from a rating upgrade as and when it occurs. Several large issuers in the high-yield market today have only been high-yield issuers since they were downgraded from investment grade during the onset of the COVID-19 pandemic in 2020, and they seek to return to the investment-grade market. In many high-yield portfolios, we also have the flexibility to hold issues rated BBB once they are upgraded, so there’s nothing forcing us to part ways with many of these rising stars. In light of the current economic environment, we are focused more on higher-quality companies that have the potential to weather a longer, more pronounced recession, and there are more of these than ever in the high-yield market.
Credit risk has migrated to the leveraged loan market
Source: Bloomberg, S&P/LSTA. High Yield represented by the Bloomberg U.S. Corporate High Yield 2% Issuer Capped Index. Leveraged loans represented by the S&P/LSTA Leveraged Loan 100 Index. Data as of June 30, 2022.
4. Finding value across a spectrum of industries
Telecommunications has been a large part of the high-yield universe for many years. Another historically large segment, consumer discretionary credits such as lodging, gaming and cruise lines, saw their valuations recover with the reopening of the economy following the pandemic. We remain selective in these sectors given the uncertain economic outlook and the leverage that issuers in these sectors took on while they were shut down during the pandemic.
We see value in certain subsectors that represent a smaller part of the high-yield market, such as asset managers and insurance brokers. Given the recurring revenue models, these types of businesses have the potential to do better than the more cyclical issuers in a soft economy or a rising rate environment. Many of these companies have had predictable cash flows, whether through management fees earned on the assets under management or via commissions earned from the sale of insurance products.
Investment time horizons matter
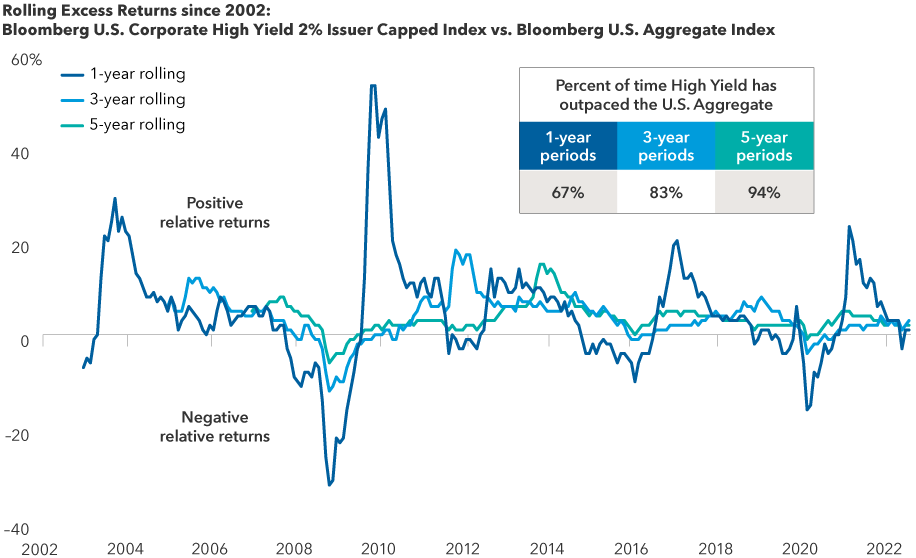
Source: Bloomberg. Data as of August 31, 2022. Data incorporates the one-year, three-year and five-year rolling monthly periods between January 2002 and August 2022.
5. Energy sector fundamentals have improved
Over the past decade, the energy segment of the high-yield market grew rapidly as issuance to finance oil/gas exploration and production ballooned. But when oil prices fell, many of those companies were forced to restructure their debts and cut back on capital spending. This wave of defaults is now behind us and the energy segment is now much smaller than it was at its peak.
Today, the energy segment is the healthiest it has been in many years. As balance sheets have improved, capex plans have been curtailed, and oil/gas prices have surged, energy has been the best-performing subsector within the Bloomberg U.S. Corporate High Yield 2% Issuer Capped Index. Elevated oil/gas prices and restrained spending on exploration and production have transformed this segment from cash-burning to massively cash-generating, and management teams appear laser-focused on protecting their now-healthy balance sheets. And so, while the sector is still cyclical, we view it as less risky today and it also features a larger number of high-quality companies in which to invest.
Bottom line
Assuming a duration of four years, given a 100-basis-point rise in interest rates, a high-yield fund would be expected to lose 4%. However, given recent yields of more than 8%, the risk of rising rates is mitigated by the high yield and coupons. Of course, additional factors could impact losses that a fund experiences.
In our view, the goal of investing in high yield is to try to manage the risks that are inherent in lower quality, lower rated companies and be appropriately compensated for the risk we take. At the same time, we are careful not to be too cautious and give up yield opportunities along the way. It is not advisable to try to time the high-yield market. We believe that investors willing to maintain a long-term perspective should consider a strategic allocation to high yield as part of an income-producing fixed income portfolio and can also be opportunistic in broader multi-sector and core plus portfolios, depending on fundamentals, valuations and investor goals.
A call option allows the issuer to redeem a bond prior to its maturity. A debt tender offer is an offer, typically by the issuer, to purchase all or a portion of its outstanding debt securities for cash at a price specified by the offeror.
Option-adjusted spread is a yield-spread calculation used to value securities with embedded options.
Yield to worst is the he lowest yield that can be realized by either calling or putting on one of the available call/put dates or holding a bond to maturity.
Duration is a measure of the approximate sensitivity of a bond portfolio's value to interest rate changes.
The S&P/LSTA U.S. Leveraged Loan 100 Index is a capped market value-weighted index designed to measure the performance of 100 large loan facilities in the U.S. leveraged loan market, based upon market weightings, spreads and interest payments. The S&P/LSTA U.S. Leveraged Loan 100 B/BB Rating Index is a sub-index of the S&P/LSTA U.S. Leveraged Loan 100 Index and is composed of loans with ratings between BB+ and B-, as determined by S&P Global Ratings.
The S&P/LSTA U.S. Leveraged Loan 100 Index (“Index”) is a product of S&P Dow Jones Indices LLC and/or its affiliates and has been licensed for use by Capital Group. Copyright © 2022 S&P Dow Jones Indices LLC, a division of S&P Global, and/or its affiliates. All rights reserved. Redistribution or reproduction in whole or in part are prohibited without written permission of S&P Dow Jones Indices LLC.
Bloomberg U.S. Corporate High Yield 2% Issuer Capped Index covers the universe of fixed-rate, non-investment-grade debt. The index limits the maximum exposure of any one issuer to 2%. This index is unmanaged, and its results include reinvested distributions but do not reflect the effect of sales charges, commissions, account fees, expenses or U.S. federal income taxes.
Bloomberg U.S. Aggregate Index represents the U.S. investment-grade fixed-rate bond market. This index is unmanaged, and its results include reinvested dividends and/or distributions but do not reflect the effect of sales charges, commissions, account fees, expenses or U.S. federal income taxes.
This report, and any product, index or fund referred to herein, is not sponsored, endorsed or promoted in any way by J.P. Morgan or any of its affiliates who provide no warranties whatsoever, express or implied, and shall have no liability to any prospective investor, in connection with this report. J.P. Morgan disclaimer: https://www.jpmm.com/research/disclosures
 Shannon Ward
 David Bradin