Economic Indicators
AdviserInstitutions & ConsultantsIndividual InvestorsInstitutions & ConsultantsFinancial IntermediariesIndividual InvestorsInstitutionelle Investoren & ConsultantsFinanzintermediärePrivatanlegerInstitutions & ConsultantsFinancial IntermediariesIndividual InvestorsInstitutions et consultantsIntermédiaires financiersInvestisseurs particuliersFinanciële tussenpersonenIndividual InvestorsFinancial AdvisorsInstitutions and ConsultantsParticuliersConseillers financiersInstitutions et consultantsFinancial IntermediariesIndividual InvestorsInstitutions & ConsultantsFinancial IntermediariesIndividual InvestorsInstitutions & ConsultantsFinancial IntermediariesIndividual InvestorsInstitutions & ConsultantsFinancial IntermediariesIndividual InvestorsInstitutions et consultantsIntermédiaires financiersInvestisseurs particuliersInstitutions & ConsultantsFinancial IntermediariesIndividual InvestorsInstitutionelle Investoren & ConsultantsFinanzintermediärePrivatanlegerFinancial IntermediariesIndividual InvestorsInstitutions & ConsultantsFinancial IntermediariesIndividual Investors機構投資者及顧問金融中介個人投資者Institutions & ConsultantsFinancial IntermediariesIndividual InvestorsInstitutions & ConsultantsFinancial IntermediariesIndividual InvestorsInstitutions & ConsultantsFinancial IntermediariesIndividual InvestorsClienti IstituzionaliIntermediari e Consulenti FinanziariInvestitori privatiJapanFinancial IntermediariesIndividual InvestorsFinanzintermediärePrivatanlegerInstitutions & ConsultantsFinancial IntermediariesIndividual InvestorsInstitutions et consultantsIntermédiaires financiersInvestisseurs particuliersInstitutionelle Investoren & ConsultantsFinanzintermediärePrivatanlegerInstitutions & ConsultantsFinancial IntermediariesInstitutions & ConsultantsFinancial IntermediariesIndividual InvestorsInstitutions & ConsultantsFinancial IntermediariesIndividual InvestorsInstitutions & ConsultantsFinancial IntermediariesIndividual InvestorsInstitutions & ConsultantsFinancial IntermediariesIndividual InvestorsInstitutions & ConsultantsFinancial IntermediariesIndividual InvestorsInstituciones y consultoresIntermediarios financierosInversores individualesInstitutions & ConsultantsFinancial IntermediariesIndividual InvestorsInstitutions & ConsultantsFinancial IntermediariesIndividual InvestorsInstitutions et consultantsIntermédiaires financiersInvestisseurs particuliersInstitutionelle Investoren & ConsultantsFinanzintermediärePrivatanlegerInstitutions & ConsultantsFinancial IntermediariesIndividual InvestorsInstitutions & ConsultantsFinancial IntermediariesIndividual InvestorsFinancial ProfessionalRIAIndividual InvestorPrivate ClientRetirement Plan InvestorInstitution or ConsultantEmployer or Plan SponsorThird-Party AdministratorU.S. Offshore AdvisorsOffshore de EE. UU.International - otherAsia - other
Investing Strategy
The last 12 months were challenging for stock and bond markets, and Capital Group’s portfolio teams don’t anticipate a less challenging environment in the near future. High inflation, a weak economic environment and continuing geopolitical risks emphasize the need for investment discipline. But where should investors look for opportunities?
Here are five key outlook themes to help advisors prepare for client conversations about risk, opportunity and portfolio construction in early 2023.
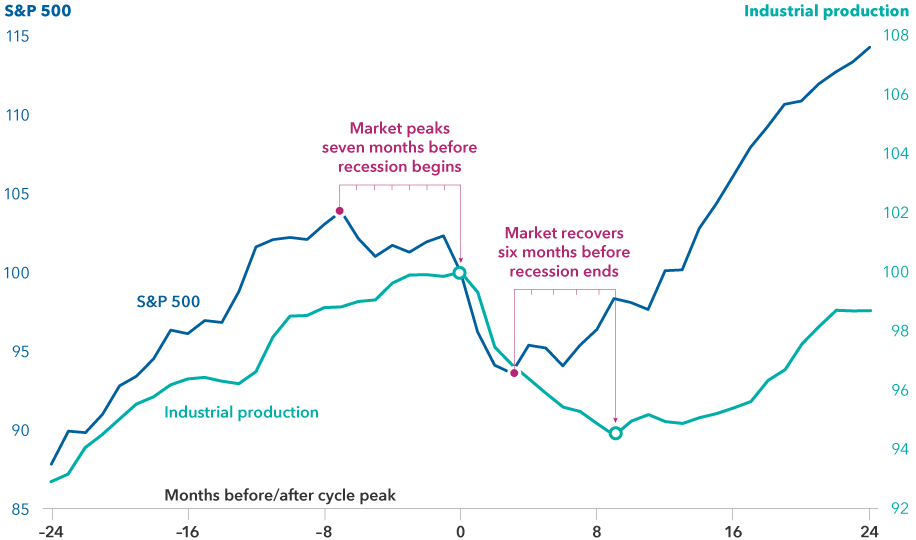
- Investors may want to be wary of sitting on the sidelines: On average, equity markets have recovered six months before a recession ends and tended to have their strongest gains following a downturn.
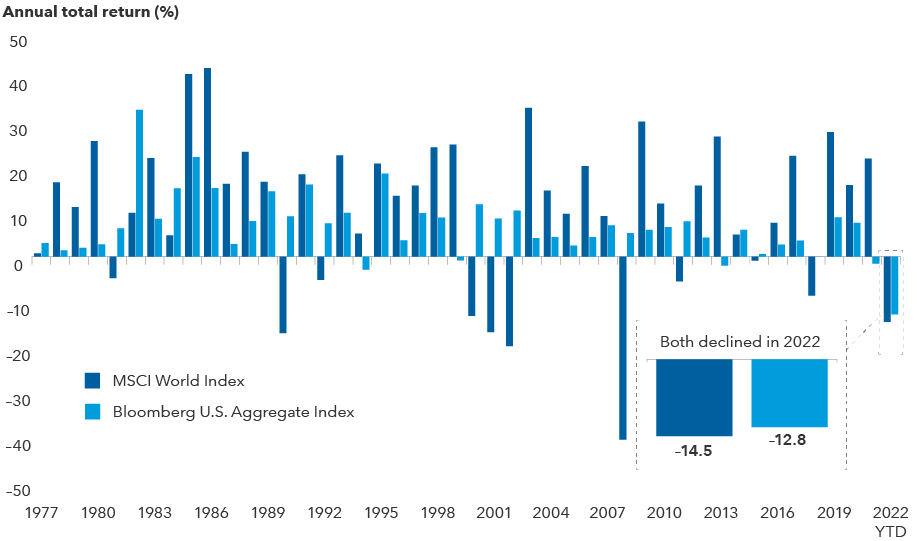
- Bonds should offer relief from equity market volatility going forward; 2022 was the first time out of the past 45 years where stocks and bonds declined in tandem.
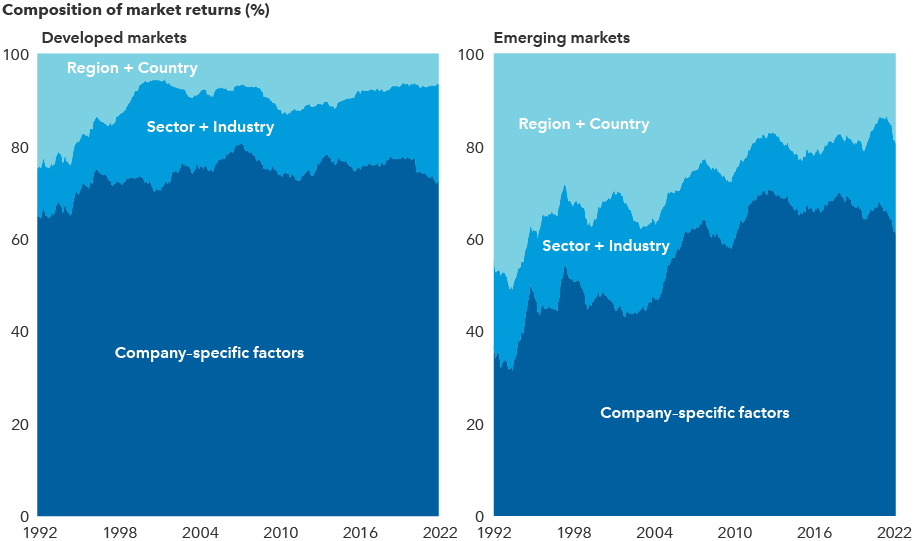
- Company fundamentals are driving returns outside the United States, emphasizing the value of individual stock picking and active investing today.
The last 12 months were challenging for stock and bond markets, and Capital Group’s portfolio teams don’t anticipate a less challenging environment in the near future. High inflation, a weak economic environment and continuing geopolitical risks emphasize the need for investment discipline. But where should investors look for opportunities?
Here are five key outlook themes to help advisors prepare for client conversations about risk, opportunity and portfolio construction in early 2023. For more information on Capital Group’s outlook for 2023, see our 2023 outlook report and our deeper dives on the investment outlook for the U.S., international and fixed income markets.
1. Look to equities to lead the way out of a downturn.
Many of the world’s leading economies appear to be heading for an economic downturn. Europe is likely already in a recessionary period, while China’s growth has substantially decelerated, exacerbated by COVID-19 lockdowns. In the United States, elevated inflation levels and increased interest rates have taken their toll on domestic growth. Capital Group economist Jared Franz expects the U.S. economy to contract by about 2% in 2023 — worse than the post-tech and telecom bubble recession of the early 2000s, but not nearly as bad as the 2008–09 financial crisis.
One thing all past recessions and bear markets have in common is they eventually ended and set the stage for the next period of growth. Capturing a full market recovery can have a meaningful impact on investment returns, as highlighted in the charts below. Often, the market’s strongest gains have occurred immediately after a downturn.
Stocks led the economy down during this latest cycle, with nearly all major equity markets entering bear market territory by mid-2022. If history is a guide, stocks could rebound about six months before the economy does. Therefore, waiting on the sidelines for an economic turnaround could be a missed opportunity if equities bounce back before the economy shows its recovery.
Stocks have tended to recover before the economy does

Sources: Capital Group, Federal Reserve Board, Haver Analytics, National Bureau of Economic Research, S&P. Data reflect the average of completed cycles in the U.S. from 1950 to 2021, indexed to 100 at each cycle peak. Industrial production measures the change in output produced by manufacturers, mines and utilities and is used here as a proxy for the economic cycle. Past results are not predictive of results in future periods.
2. Bonds should reclaim their status as equity diversifiers.
2022 was one of the worst years for bond market returns on record. Substantial losses have led many investors to question the long-standing principal that bonds offer relative safety when stocks decline. Could bonds offer some relief from volatile equity markets in 2023?
Stocks and bonds rarely decline in tandem. In fact, calendar year 2022 was the only period on record over the past 45 years where this phenomenon occurred. Bonds are once again expected to offer diversification benefits and relief from volatile equity markets as recession concerns come into focus.
Reports of lower inflation coupled with growth concerns could allow the U.S. Federal Reserve to slow down its rate hikes. “I believe we are close to that point,” says Pramod Atluri, Capital Group fixed income portfolio manager. “Once the Fed pivots from its ultra-hawkish monetary policy stance, high-quality bonds should again offer relative stability and greater income.”
Stocks and bonds rarely decline in tandem

Sources: Capital Group, Bloomberg Index Services Ltd., MSCI. Returns above reflect annual total returns in USD for all years except 2022, which reflect the year-to-date total return for both indexes. As of November 30, 2022. Past results are not predictive of results in future periods.
3. Dividend-paying equities should be a more significant contributor to total returns going forward.
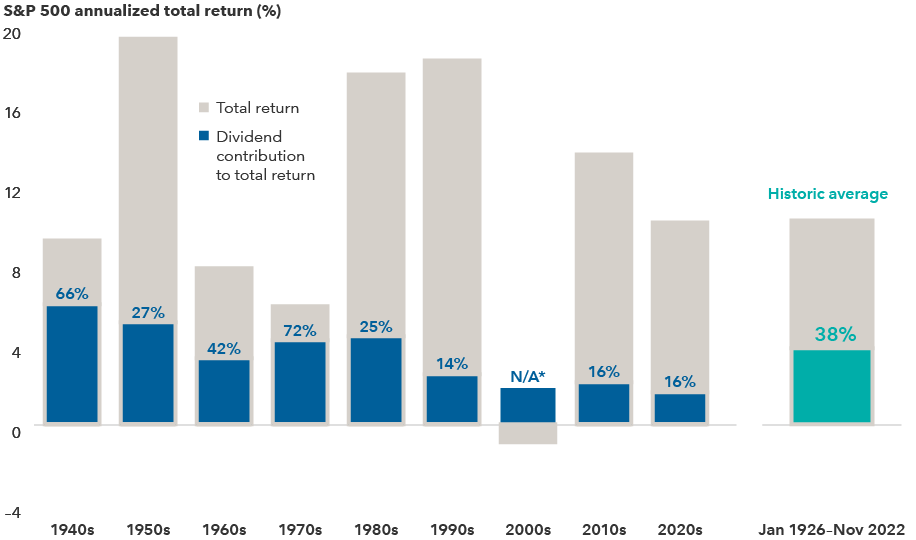
While dividends accounted for just 16% of total returns for the S&P 500 Index in the 2010s, historically they have contributed an average of 38%. Companies that have paid steady and above-market dividends can be found across various sectors including financials, energy, materials and health care. Higher dividend yields may cushion the fall during market corrections, offering a measure of downside protection when volatility is on the rise.
“With growth slowing, the cost of capital rising and valuations for less profitable tech companies declining, I expect dividends to be a more significant and stable contributor to total returns,” says Capital Group equity portfolio manager Caroline Randall.
Dividends play an important role in equity returns

Sources: S&P Dow Jones Indices LLC. 2020s data are from January 1, 1926, through November 30, 2022.
*Total return for the S&P 500 Index was negative for the 2000s. Dividends provided a 1.8% annualized return over the decade. Past results are not predictive of results in future periods.
4. In the current cycle, don’t just sit on the sidelines in fixed income.
Historically, it has paid to invest in fixed income prior to the final Fed rate hike during rising rate environments. With the Fed expected to end its hawkish stance in mid-2023, maintaining an allocation to bonds may be sensible for some investors.
Over the last 40 years, there have been six rate-hiking cycles. Purchasing bonds regularly for a year starting six months prior to the last rate hike in each of those cycles would have returned a range of 3.3% to 10.2% in the first 12 months. Longer term, that year-long investment would have provided a 5-year annualized total return ranging from 5.9% to 15.6%. Of course, past results are not predictive of future returns.
“As active managers we aim to purchase bonds with good prospects using fundamental research while also accounting for macroeconomic conditions,” says Atluri. “Markets move fast. I’d rather be early than late when it comes to positioning the portfolios I manage.”
It may pay to invest prior to a final rate hike

Sources: Capital Group, Bloomberg. Chart shows date of the last hike in all Fed hiking periods since 1981, excluding the 2018 peak which does not yet have five years of data. Hypothetical 12-month dollar cost average return is the total return for a level monthly investment for 12 months starting six months prior to each last rate hike. The hypothetical 5-year return annualizes the total return for that first 12 months plus four more years, assuming no additional investment after that first year. Regular investing does not ensure a profit or protect against loss. Investors should consider their willingness to keep investing when share prices are declining. Past results are not predictive of results in future periods.
5. Company fundamentals matter in international equity markets.
In recent years, there is no doubt that investors have been frustrated with the persistent lagging returns of international equities. A strong U.S. dollar, weak economies in Europe and Japan, and various obstacles in emerging markets have created a cloudy near-term outlook.
However, investors should remember that there is a difference between top-down macroeconomic views and the fundamental, bottom-up prospects for individual companies. Company fundamentals are driving returns outside the United States, placing added importance on individual stock picking. Therefore, an active investment approach may be beneficial for international equity exposure.
Company-specific factors drive international equity returns

Source: Empirical Research Partners. As of September 30, 2022. Analysis provided by Empirical Research Partners using their developed market and emerging market stock universes that approximate the MSCI World Index and MSCI Emerging Markets Index, respectively. Data show the percentage of market returns that can be attributed to various factors over time, using a two-year smoothed average. Past results are not predictive of results in future periods.
Looking for a New Year’s resolution? Take a more proactive approach.
In 2023, you can expect several familiar headwinds, including a rocky geopolitical landscape, elevated inflation, rising yields and hawkish central bank policy. However, there are reasons to be optimistic, including an abundance of possibilities for selective investing rooted in bottom-up, fundamental research.
As you review your clients’ portfolios for potential areas of opportunity, consider scheduling a portfolio consultation with a Capital Group specialist today.
To read the full article, become an RIA Insider. You'll also gain complimentary access to news, insights, tools and more.
RELATED INSIGHTS
-
Economic outlook: Global growth dependent on a resilient U.S.
-
Bonds
Bond outlook: Opportunities emerge as Fed delays rate cuts -
Economic Indicators
Economic outlook: U.S. powers global growth
For financial professionals only. Not for use with the public.
For financial professionals only. Not for use with the public.