
Wealth Planning
Long-Term Investing
Markets have rewarded patient, thoughtful investors
 Mark Casey
May 3, 2024
I’m sure you don’t spend your days gazing at long-term stock market charts. But it's worth a quick look at these two linked charts, which together encapsulate the history of the stock market and puts it into perspective at the same time.
The charts trace the performance of the S&P 500 dating back to the latter stages of the Great Depression. Two dynamics stand out. The first is the sometimes jagged, but steady climb in the index over time. The second is the long list of troubling events. Some were genuinely era-defining and occasionally even catastrophic, such as the attack on Pearl Harbor and the U.S. entry into World War II. Many others ended up being comparatively self-contained even though they felt momentous at the time.
Ever since the Great Depression, the S&P 500 has consistently overcome obstacles and moved higher
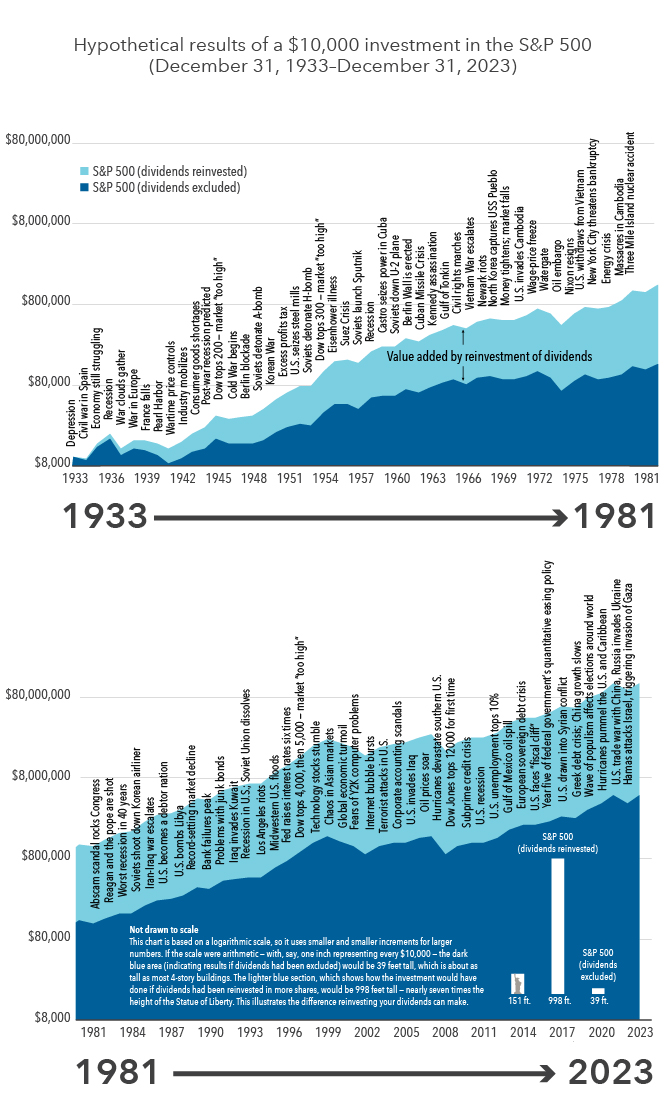
Source: S&P Dow Jones Indices LLC. Figures are shown on a logarithmic scale. The indexes are unmanaged and, therefore, have no expenses. Investors cannot invest directly in an index. Past results are not predictive of results in future periods. As of December 31, 2023.
The lesson I draw from these charts is straightforward. There have always been supposed reasons not to invest — heated political clashes, economic setbacks or societal upheaval— and yet the market overcame all of these obstacles amid economic growth and technological innovation. Of course, past is not prologue and there’s no guarantee for the future.
But charts like this show that long-term investors have had markets on their side. Some people try to do better than the chart by reducing their holdings at what they think are peaks and adding at what they think are troughs. It sounds like this should work, but in practice these people often do worse than those who just buy, hold, stay put and make themselves content with the idea of getting the whole chart.
That’s partly because each sale involves transaction costs and taxes and each purchase involves more transaction costs. But it’s also because, quite frequently, what you think is a peak isn’t actually a peak. When the trough shows up you don’t have the courage to buy back in. Timing the market often results in poorer results than the chart as a whole. Instead, I believe in finding promising businesses and staying invested.
To that end, I try to make accurate predictions about what the world will look like in five, 10 or 20 years. Everyone can have these horizons — if somebody is 40 and they’re going to retire at 65, they need to have at least a 25-year view on investing. I love the phrase, “Time in the market is more important than timing the market.”
I also pick those timeframes because I think it’s easier to be accurate about big, long-term trends than about what’s going to happen in a year or two. Benjamin Graham, the father of value investing, famously explained that in the short term, the market is a voting machine and prices are determined largely by sentiment, emotion, fashion and near-term concerns. Those are very hard to predict. But in the long term, he said the market is a weighing machine and things tend to be valued closer to what they’re actually worth. In some ways, that’s much easier to predict than the voting machine.
Explore topics
Related Insights
Related Insights
-
-
Global Equities
-
Market Volatility