Economic Indicators
Economic Indicators
For much of the past two decades, investors had to resign themselves to chronically low bond yields. Skimpy yields were just a fact of life — admittedly not as grim as death and taxes but no less immutable. Various economic and political forces conspired to suppress bond yields, especially the Federal Reserve’s frequent use of rate cuts as an all-purpose solvent for financial crises or floundering growth.
Well, bonds are back. The central bank’s determined effort to blot out inflation has pushed 10-year Treasury yields to their highest level in 16 years. That’s made bonds unusually attractive, with compelling opportunities throughout the fixed income world.
Improved yields come against an economic backdrop that has brightened of late. Inflation has slowed considerably, the red-hot job market has downshifted a bit and wage gains have moderated. At the same time, employment continues to grow and U.S. consumers are their normal intrepid selves. That hard-to-achieve balance has raised the odds of a “soft landing” in which inflation contracts without the economy splintering.
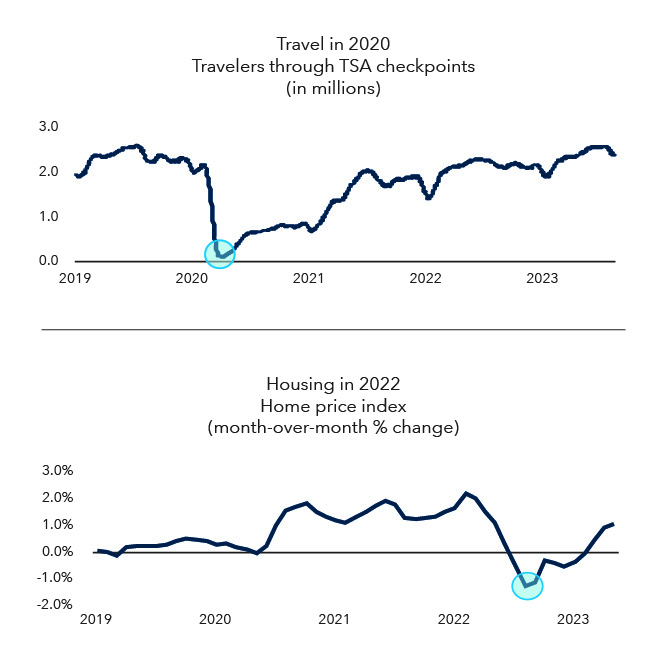
The soft-landing case is supported by the idea that some sectors endured their own mini-recessions in recent years, such as travel during the pandemic and housing in 2022 after mortgage rates jumped. The net effect has been a “rolling recession” in which excesses have been wrung out of some areas without GDP itself turning negative.
Still, the risk of an economic contraction remains elevated. Inflation is still almost twice the Fed’s preferred level. Higher interest rates take time to snake through the economy and may yet impinge on consumer and business behavior. Lending standards have tightened.
A "rolling recession" may have hit sectors at different times, masking the overall impact on markets and the economy

Sources: Capital Group, LSEG. Travel: Transportation Security Agency (TSA) checkpoint travel throughput. Data is a 30-day moving average. As of August 31, 2023. Housing: S&P CoreLogic-Case-Shiller 20-City Composite Home Price Index (month-over-month % change). Latest available monthly data is June 2023. As of August 25, 2023.
The U.S. is also confronting an especially high number of external forces. That includes the autoworkers’ strike, the political discord in Washington and the recurrent threat of government shutdowns. The incipient war in the Middle East adds new uncertainty, particularly if the armed conflict widens or oil flows are disrupted.
Big Tech may be a blessing and a curse.
In the stock market, the story continues to be the outsize influence of the so-called Magnificent Seven — Alphabet, Amazon.com, Apple, Meta, Microsoft, NVIDIA and Tesla. These megacaps now comprise a stunning 25% of the S&P 500 by weight and account for 84% of the index return this year. The behemoths surged over the summer in a rally fired by enthusiasm over artificial intelligence, but they led the market down slightly in the third quarter as the initial euphoria passed.
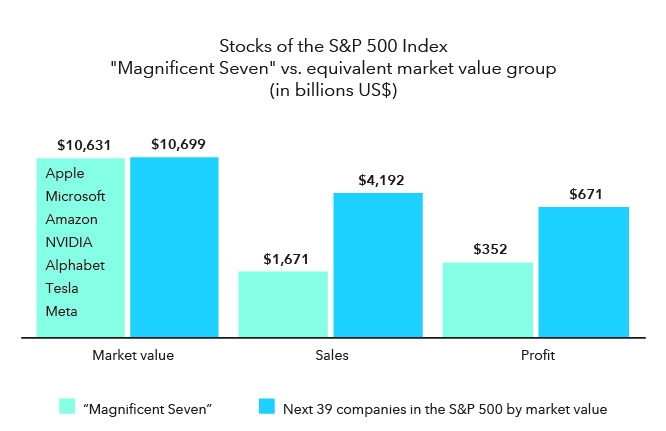
The "Magnificent Seven" have to grow a lot to justify today's valuations

Source: LSEG. Next 39 companies represents the 39 stocks following the "Magnificent Seven" in order of market value. Market value is the latest consolidated value of a company. Sales is the net sales (or revenue) of the relevant item reported in the last twelve months. Profit is represented by the latest available trailing 12-month operating profit. As of September 29, 2023.
Looking forward, history suggests the megacap dominance may not persist. Despite these companies’ enormous promise, it could be difficult to live up to their swollen valuations and giddy investor expectations. The accompanying chart shows that the Magnificent Seven’s combined market cap is roughly equal to the next 39 companies in the S&P 500, which are themselves leaders in their fields. But the tech giants’ sales and earnings pale next to the other businesses. In megacap rallies of the past — including the “Nifty Fifty” of the early 1970s and the dot-com bubble of the late 1990s — the goliaths lagged the rest of the market in subsequent years.
Bonds are attractive versus other asset classes.
The rise in interest rates has pushed fixed income yields well above their 5-year averages. For example, today’s 5.4% yield on the Bloomberg US Aggregate Index, which measures taxable bonds, is twice its 2.7% average. The current 4.3% yield on the Bloomberg Municipal Index tops its 2.2% average.
In fact, one indicator suggests that bonds have become comparatively more attractive than U.S. stocks. The measure, known as the equity risk premium, compares the earnings yield on stocks to the 10-year Treasury yield. On average, there is a 3-4 percentage point premium for stocks to compensate for the extra risk involved in owning equities. Today, that premium is just 1 percentage point.
Stocks are still projected to return more than bonds in coming years. But when the extra risk associated with equities is factored in, bonds are more attractive on a risk-adjusted basis than at any point in the past 20 years.
Don’t be lulled by cash.
The rise in yields has also breathed life into cash returns, especially those of long-anemic money market funds. It makes sense to hold cash for near-term spending needs. Historically, however, ultra-short instruments have not been the best route for the long term.
Money fund yields generally follow the direction of the federal funds rate, which is the central bank’s key interest rate. In other words, money fund yields fall when the central bank starts to lower interest rates. In the last four loosening cycles dating to 1995, the benchmark 3-month Treasury yield fell an average of 2.5 percentage points within 18 months after the fed funds rate hit its peak. Not surprisingly, stocks and bonds both outpaced cash once the Fed stopped hiking rates.
The current market consensus is that the Fed is nearing the end of its tightening cycle and could cut rates next year, although the projected timing is a subject of vigorous debate. Capital Group economic analysts believe interest rates may hold around their current levels into 2024 although rate cuts are possible later in the year.
Regardless of the Fed’s direction and timing, this may be a good time to speak to your Private Wealth Advisor about the fixed income allocation in your portfolio.
S&P 500 Index is a market capitalization-weighted index based on the results of approximately 500 widely held common stocks. This index is unmanaged, and its results include reinvested dividends and/or distributions but do not reflect the effect of sales charges, commissions, account fees, expenses or U.S. federal income taxes.
The S&P 500 Index (“Index”) is a product of S&P Dow Jones Indices LLC and/or its affiliates and has been licensed for use by Capital Group. Copyright © 2023 S&P Dow Jones Indices LLC, a division of S&P Global, and/or its affiliates. All rights reserved. Redistribution or reproduction in whole or in part is prohibited without written permission of S&P Dow Jones Indices LLC.
