Trade
Economic Indicators
It had a snappy name. It boasted seemingly irrefutable logic. And it became gospel across much of Wall Street. But in the end — no spoiler here — the “most widely predicted recession in history” never came. A year that many feared would be marred by a Federal Reserve-induced downturn ended instead with blistering rallies in stocks and bonds as inflation softened without the economy curdling.
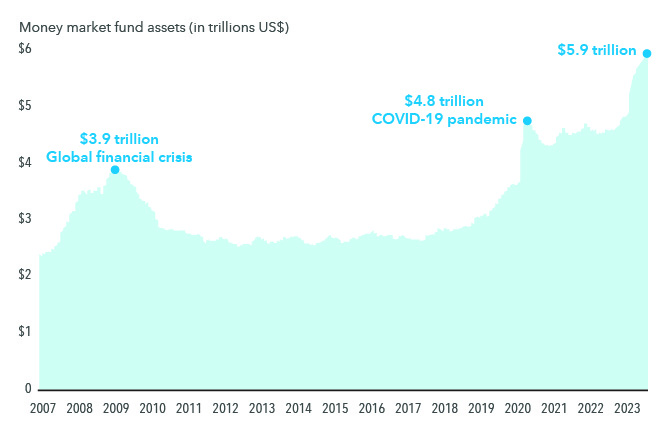
There are plenty of lessons to be gleaned from the economy’s improbable showing. But the biggest may be that economic conditions and market sentiment can shift in a heartbeat, and it’s risky to time the market. The ubiquitous talk of recession caused investors to throng to the perceived safety of cash. Assets in money market funds hit a record $5.9 trillion, more even than the total during the pandemic.
But while equities and fixed income struggled at times, they both whistled higher in the final weeks of the year as the Fed signaled that it may be done raising rates and might actually lower them later this year. That makes the prospect of a soft landing more plausible. The S&P 500 ended the year up more than 26%, a missed opportunity for anyone who ditched stocks for cash. The stock and bond rallies appear to resemble past episodes in which markets advanced in the 12 months after the Fed stopped hiking rates.
What happens to that money fund stockpile — specifically, whether markets push higher if investors redeploy it to equities and fixed income — will be a key storyline during 2024. Indeed, there are plenty of reasons for optimism going forward, especially if coveted rate cuts materialize. But there’s also a slew of challenges — including a top-heavy stock market, a combative presidential election and rising concern about budget deficits — that may conspire to keep volatility elevated.
Cash has surpassed its pandemic peak to reach a new all-time high

Sources: Capital Group, Investment Company Institute (ICI). In the chart, “cash peak” refers to peak money market fund assets. Unlike cash which may be insured or guaranteed by the Federal Deposit Insurance Corporation, dividend-paying stocks, short- and intermediate-term bonds are not guaranteed and are subject to loss. As of December 28, 2023.
Stalwart consumers keep opening their wallets.
On the positive front, the economy continues to be driven by well-chronicled forces, including a solid job market and free-spending consumers propelled by ample household wealth and beefy home prices. Economic growth is projected to advance across much of the world in 2024, with corporate earnings forecast to climb smartly.
Of course, there’s no shortage of obstacles. Though a soft landing remains the likeliest outcome, a recession remains possible if inflation reignites or the job market weakens. The labor picture is strong overall, but it has softened of late, with job openings falling, continuing unemployment claims rising and wage gains moderating.
Inflation is another question mark. The inflation fight has gotten an assist from improved productivity, which helps suppress unit labor costs. The 2.4% productivity rise in the third quarter ranks among the highest non-pandemic gains of the past decade. More progress is possible if businesses can harness artificial intelligence to boost efficiency. But while inflation has backpedaled significantly, it still exceeds the Fed’s desired level. A sudden jump could prompt the Fed to raise rates again — or, perhaps more likely, delay rate cuts that the market is counting on.
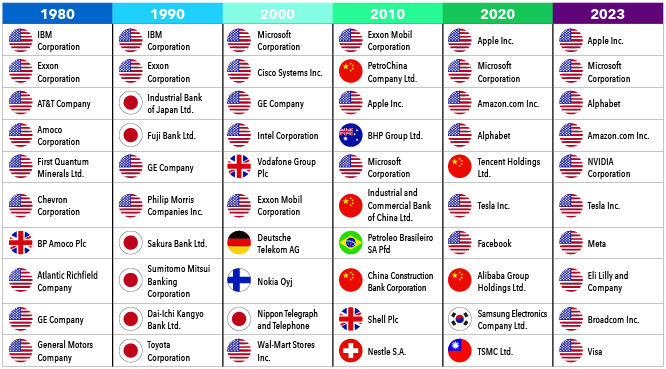
The ranks of the world’s largest businesses by market cap have shifted dramatically over the years

Sources: Capital Group, FactSet investable universe. 2020 and 2023’s lists excludes Aramco and Berkshire Hathaway. Indexes are unmanaged and, therefore, have no expenses. Investors cannot invest directly in an index. Past results are not predictive of results in future periods. Data is as of December 31 for each year, except 2000, which is as of February 28, 2000.
The stock market has become extremely top-heavy.
The most immediate issue for the stock market may be the direction of big-name technology stocks after a year of blowout gains. The so-called Magnificent Seven — Alphabet, Amazon.com, Apple, Meta, Microsoft, Nvidia and Tesla — leapt a mind-bending 76% last year while the other 493 companies in the S&P 500 rose a more sober-minded 14%.
The Big Tech romp has produced a top-heavy market in which 10 companies comprise a whopping 31% of the index. That’s a heavier concentration than during the late-90’s dot-com bubble, and it leaves the entire index susceptible to big swings in a handful of stocks. History suggests the mega-cap outperformance may not last and that better relative values exist in other sectors with lower valuations (such as industrials), dividend payers and international companies.
Though Goliaths can appear to be indomitable, history shows that many can lose steam and be overtaken in market leadership. Consider the chart above, which depicts how the ranks of the world’s biggest businesses have been shuffled over time as economic and industry forces changed. For example, only six companies atop the list in 2020 were still there at the end of 2023. Go back to 2010, and there were only two holdovers.
You’ll find more on the key issues of 2024 in our annual stock and bond roundtables. As always, Capital Group analysts and portfolio managers share their thoughts on the forces they’re watching and the opportunities they’re seeing.
Related Insights
Related Insights
-
Will economic uncertainty knock the Fed off course?
-
Trade
Understanding tariffs in 5 charts -
Interest Rates
Will economic uncertainty knock the Fed off course?
