Economic Indicators
Economic Indicators
More than anything else, waiting for the Federal Reserve to lower interest rates is an exercise in patience. Divine patience.
Anticipation of imminent rate cuts helped the stock market barrel to a series of new highs as the year began. The enthusiasm was fed partially by the central bank itself, which has repeatedly pledged to tone down borrowing costs. But forceful economic growth — and lingering inflation — have complicated matters.
Rate cuts are still likely. But their eventual timing and magnitude are big question marks, and how policymakers proceed could go a long way toward determining the near-term direction of the financial markets.
The uncertainty over monetary policy is set against an otherwise sunny backdrop. A well-lubricated labor market continues to produce effusive consumer spending. Equally noteworthy, consumers’ purchasing power has risen as wage gains outstrip inflation for the first time since the pandemic.
The inflation outlook offers equal reasons for optimism and caution. Overall, consumer price hikes have been grinding lower. Goods inflation has eased significantly thanks to normalized supply chains and the end of overheated pandemic spending. Soaring rents are expected to moderate. The outlier is services, where inflation still tops 5% and is unlikely to back off elevated levels anytime soon.
Inflation figures were higher than expected in each of the first three months of the year. That has dealt a blow to investors who cottoned to the notion that the Fed would start cutting in June and lower rates three times this year. Capital Group’s U.S. economist believes it might take longer to yank inflation back to 2% and that, at most, there will be two rates cuts this year — and as few as none.
Though a recession is not expected, it’s still a possibility. The index of leading economic indicators has never been in negative territory for this long without a contraction setting in. And though the 3.9% unemployment rate is near a historic low, it’s nonetheless jumped a half-point from the bottom — a condition that has often preceded downturns.
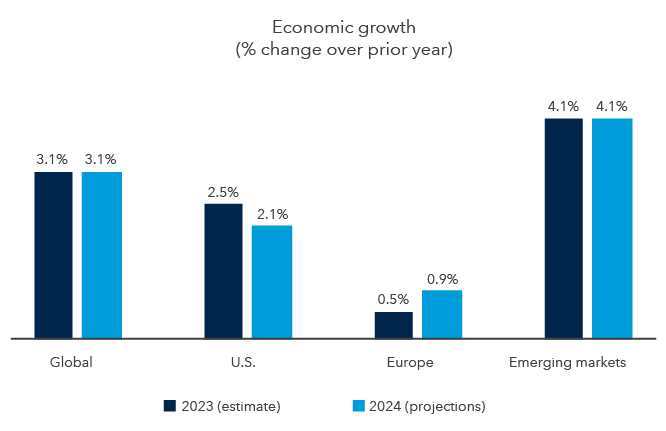
Nevertheless, the likelier outcome is for a soft landing, in which inflation pulls back without a wrenching recession. Global GDP is expected to match last year’s solid 3.1% rate, with corporate earnings growth forecast to accelerate in coming quarters. That prospect helped stock markets around the world reach new highs this year.
Economic growth is projected to continue apace around the world

Source: International Monetary Fund (IMF). Growth is measured in annual change to gross domestic product (GDP). Europe refers to the Euro Area as defined by the IMF. As of January 2024.
The “Magnificent Seven” have been downsized to the “Fab Four.”
In the U.S., the overarching story continues to be the “Magnificent Seven” — although the subtext has shifted. The technology Goliaths — Alphabet, Amazon.com, Apple, Meta, Microsoft, Nvidia and Tesla — maintain their collective hammerlock on the market, comprising a whopping 29% of the S&P 500.
Their levitation has pushed up the valuation of the overall market. U.S. stocks now trade at a relatively high 21 times earnings. But that’s due primarily to tech, where the multiple is elevated even by the sector’s traditionally lofty standards. The rest of the market appears to be far more reasonably priced.
But fissures have emerged among the “Magnificent Seven” — most notably in Tesla, which was the S&P 500’s worst performer in the first quarter amid tougher competition in China and slackening demand for electric vehicles in the U.S. A government antitrust lawsuit weighed on Apple shares, while the soft ad market has impacted Google parent Alphabet. As a result, the group’s been unofficially rechristened as the Fab Four.
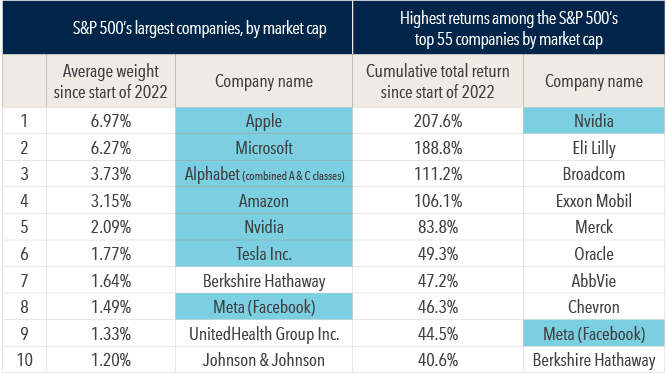
Diversification can pay off despite the “Magnificent Seven’s” exuberance

Sources: Morningstar, S&P 500 Index. Data is based on the 55 most heavily weighted companies in the S&P 500 and filtered by the top 10 average weight and top 10 cumulative total returns since January 1, 2022. Alphabet's A and C share class return data have been combined. The data shown are from January 1, 2022, through March 31, 2024. Past results are not predictive of results in future periods. Shaded light blue boxes indicate companies that are part of the “Magnificent Seven.”
The retrenchment in those stocks underscores the importance of avoiding the frenzies that can erupt in certain pockets of the market. Despite bright prospects for evolving technology such as artificial intelligence and EVs, investors can get ahead of themselves as real-world applications take time to pan out. What’s more, short-term booms in prominent companies can overshadow equally appealing opportunities in lower-profile businesses.
That's depicted in the accompanying chart, which measures S&P 500 companies over the current market cycle from the start of 2022 through the first quarter of 2024. By market cap, tech giants hold seven of the top 10 spots. But when examining the actual returns over that period of the 55 largest companies, only two of those tech behemoths make the Top 10. That's a reminder that excellent opportunities can exist outside the headlines.
Don’t let the election affect your investment strategy.
It goes without saying that the U.S. election is likely to remain the major news story as the year unfolds. Capital Group analysts are studying the potential long-run policy implications depending on which candidate occupies the White House and which party controls Congress.
However, it’s important for investors to avoid overreacting to elections. Historically speaking, elections have made essentially no difference in long-term investment returns. Over time, stocks have moved higher regardless of which party has been in power.
Though the market has tended to be volatile during primary seasons, investors have been rewarded for staying the course. Since 1932, the S&P 500 has gained an average of 11.3% in the 12 months following the conclusion of the primaries compared to just 5.8% in similar periods of non-election years.
Bonds weakened as interest rates stayed high.
After solid gains last year, fixed income returns were held back as fear mounted that the Fed might not cut rates as aggressively as the market hoped. However, the outlook for fixed income investors remains favorable, as the rise in rates last year can translate into higher returns over time.
A potential source of strength may come in the form of the roughly $6 trillion sitting in money market funds, a portion of which could find its way into the equity and fixed income markets when the Fed finally starts lowering rates. For comparison’s sake, the entire municipal bond market totals $4 trillion. If only a fraction of this money were to flow into muni bonds, it could drive a meaningful rally.
In the meantime, please reach out to your Private Wealth Advisor if you have any questions about your portfolio or developments in the markets.
