
Economic Indicators
China
4 insights from our recent trip to China
 Christopher Thomsen
 Lawrence Gong
 Kent Chan
August 28, 2024
We recently toured five cities in China, visiting two dozen companies in Shanghai, Beijing, Suzhou and Shenzhen, home to the country’s leading technology firms. As we traveled the country, taking in an endless landscape of buildings, factories and office parks, we were struck by how things have improved over the past five years despite long-lasting COVID lockdowns, economic challenges and geopolitical uncertainty.
We had blue skies every day. Maybe it’s all the electric vehicles (EVs) dominating the streets, the slowdown in the economy or fewer active construction sites, but the reduction in pollution was a noticeable change. And as usual, the modern infrastructure was incredible.
Since the regulatory intervention on the private sector four years ago, many foreign investors have redirected capital from China and shifted investments into other emerging markets, like India, or more developed countries such as Japan, which is undergoing a revival. Whatever one may think of the government’s policies, China’s economy is here to stay. It’s still the world’s second largest, with a vast domestic consumer base and investment opportunities to selectively invest in the more than 650 companies in the MSCI China Index.
The team hits the road in Shanghai

Source: Capital Group
Here are some observations from our travels.
1. Potential for an improvement in valuations
Many companies are now trading at very attractive valuations after a multiyear selloff. In our view, the government is slowly pivoting to supporting the economy. If they can set a floor on declining home prices, it would go a long way to unlocking household savings, reviving economic growth and improving investor and domestic sentiment.
Policymakers took a more concerted step in that direction in May, when they reduced required down payments, lowered mortgage rates and unveiled a plan for local governments to buy unsold properties and convert them into affordable housing. The People’s Bank of China and state-owned banks also cut key lending rates in late July.
In our view, this signaled party leadership may be slowly pivoting to support the economy. This inflection point could help improve sentiment and perhaps valuations to a level more consistent with gross domestic product (GDP) growth in the range of 3% to 5% over the next few years. There are no quick fixes. But if top policymakers can make progress in solving property sector challenges, consumer sentiment and the economy could improve, setting the stage for equity gains.
China trades at 20-year low to EM benchmark on relative valuation basis
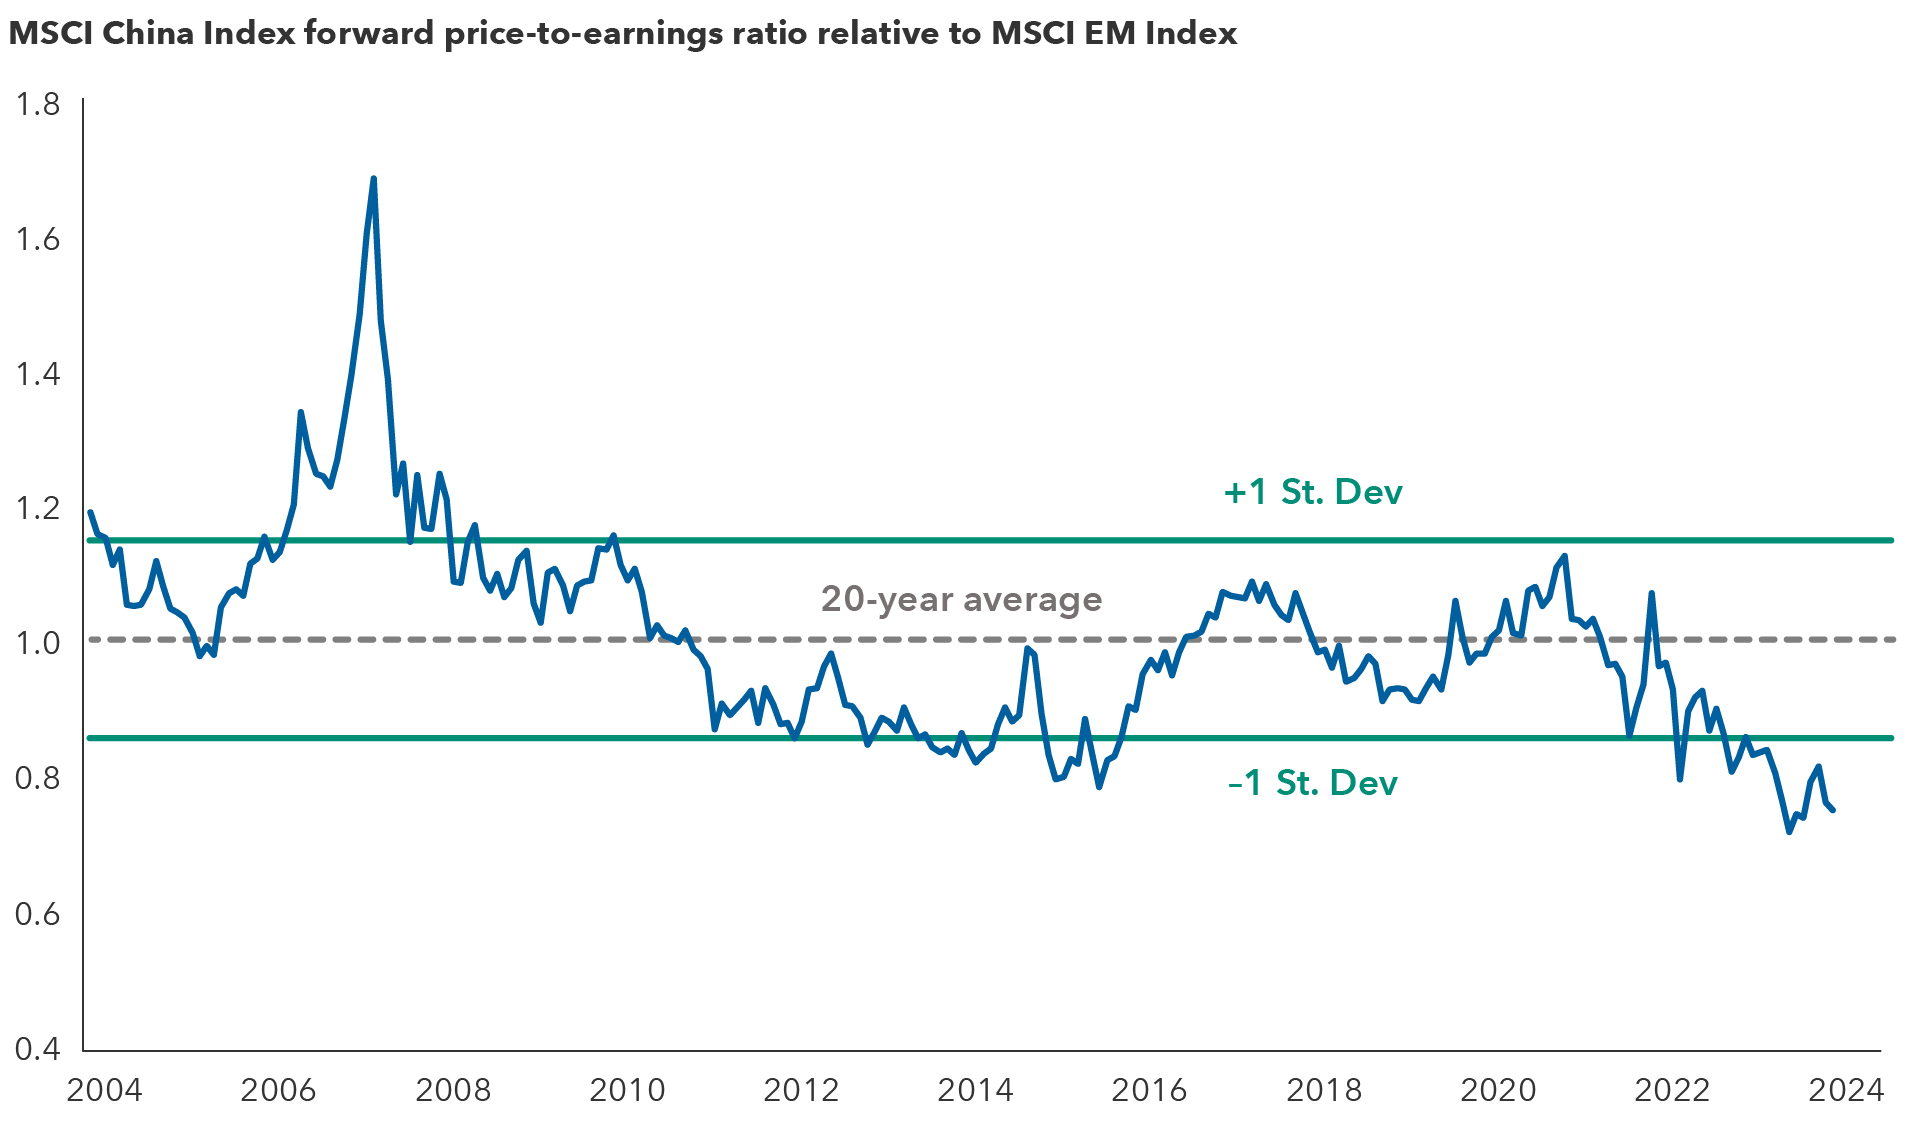
Sources: Capital Group, FactSet, MSCI. Data as of July 31, 2024. St. Dev.= standard deviation. The vertical axis represents the ratio between the price-to-earnings of the MSCI China Index and the price-to-earnings of the MSCI Emerging Markets Index. Forward price-to-earnings ratio reflects the current share price relative to the consensus estimate for earnings per share on a 12-month forward basis.
2. Companies are more focused on capital returns
There are signs of fundamental change that may boost valuations. In our meetings, there was a palpable sense that companies are less focused on growth at any cost and more focused on greater discipline in capital allocation. Regulators also appear to be taking a page out of Japan’s playbook — encouraging companies to pay more in dividends and pursue stock buybacks to improve shareholder returns.
China’s internet platform companies, for example, are also rationalizing their businesses. They have been cutting costs, exiting unprofitable business ventures, selling equity stakes in other internet companies and planning to return more money to shareholders.
Along those lines, Meituan, a leader in mobile food delivery services, launched a buyback valued up to $2 billion. Social media giant Tencent this year plans to double the size of its buyback program to around $13 billion and increase its dividend by 42%. Meanwhile, video game maker NetEase has returned $2.3 billion a year on average to shareholders in dividends and stock buybacks since 2021, representing close to 60% of its free cash flow.
Overall, if Chinese companies maintain positive free cash flow and follow through on dividends and buybacks, it could lead to a more balanced profile of stock returns in the years ahead.
Are China tech stocks ready for a move?
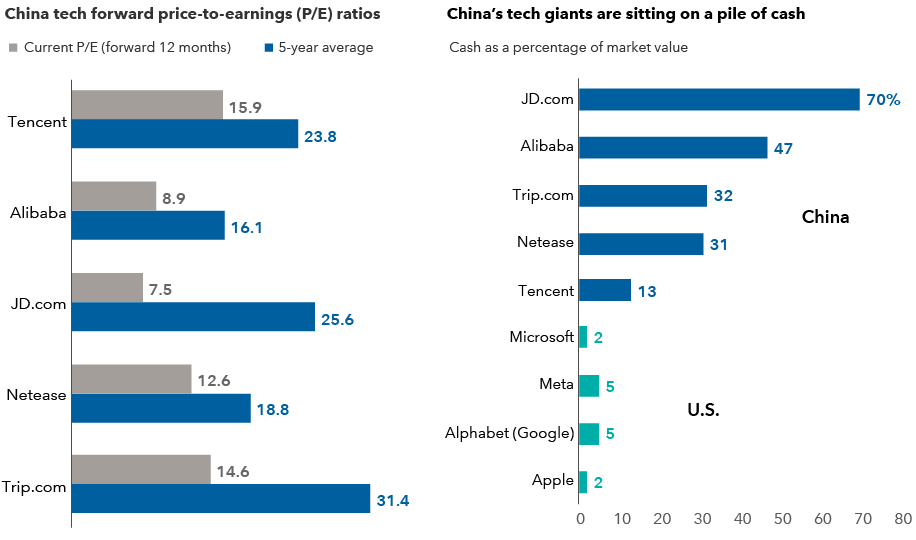
Source: FactSet. Forward price-to-earnings ratio reflects the current share price relative to the consensus estimate for earnings per share on a forward 12-month basis. Companies listed were among the 15 largest by weight in the MSCI China Index and are China's largest in areas of social media, e-commerce, online video game publishing, and online travel services as of June 30, 2024. Data for cash and short-term investments is as of March 28, 2024. Market value as of June 28, 2024. U.S. companies listed are among four largest by weight in the MSCI USA Index as of June 30, 2024, and are global leaders in areas of software, online search, social media and smart phones.
3. China is leading the global charge in electric vehicles
It’s pedal to the metal for China’s EV industry. Compared to a trip a few years ago, the lineup and pipeline of EVs was the most impressive change we saw. The cars are of striking quality at great prices. It was the biggest surprise during our travels.
Take Xiaomi, the world’s third-largest smartphone maker. In three years, the company built an EV from scratch (where Apple failed) and built a highly automated EV manufacturing plant that can produce 120,000 cars a year. Xiaomi’s first model, launched in April, has been considered a huge success and follow-up models are coming.
Telecom giant Huawei has also entered the fray, selling its software that helps power EV operating and power management systems. It has also partnered with manufacturer Seres to sell a vehicle of its own.
Despite the amazing strides in innovation, we are sitting tight. We would rather be customers than shareholders in China’s auto industry at this stage of the race. The entry of Huawei and Xiaomi further complicates industry oversupply. Plus, the brutal price war between China’s automakers could last for several years. We anticipate a shrinking profit pool will trigger a wave of consolidation, at which point we would become more interested in being investors. In the meantime, we will explore opportunities to invest in EV suppliers.
4. Consumers are down but not out
Consumers have become more price conscious and cautious. Discount e-commerce platforms are thriving, as well as some domestic consumer brands and travel-related businesses. Consumption is improving in certain areas. For example, domestic travel has rebounded this year, surpassing 2019 pre-pandemic levels. In Macau, a popular entertainment destination, there are indications of a continued recovery, with overall visits tracking higher than last year. The pace of recovery is difficult to model with precision, but from the activity we saw on the ground, things are headed in the right direction.
The casinos didn’t waste time during COVID. The older properties were refreshed, the new properties are stunning and the malls are beautiful. And the casinos have worked hard to add family-fun attractions to diversify away from gaming.
Consumers dined at home as restaurant inflation remains high
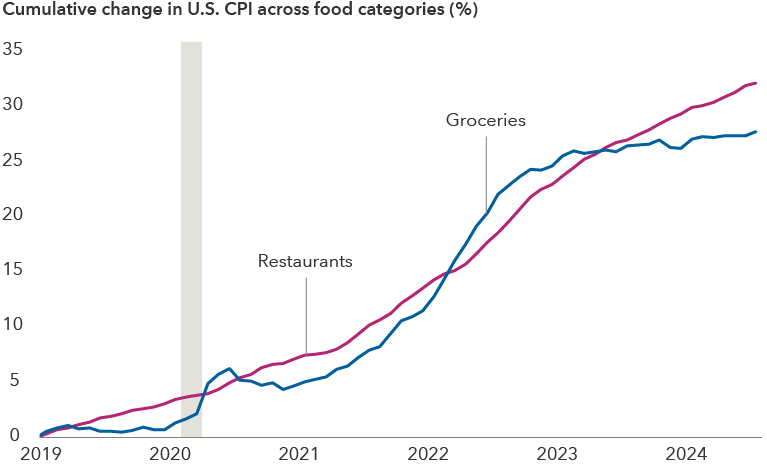
Sources: Capital Group, Bureau of Labor Statistics, National Bureau of Economic Research (NBER). Shaded region indicates period defined as a recessionary period by the NBER. Cumulative change shown is for the U.S. Consumer Price Index (CPI) for All Urban Consumers: Food At Home (groceries) and U.S. CPI for All Urban Consumers: Food Away From Home (restaurants) between December 2018 and July 2024.
Luxury goods spending has softened. There was less foot traffic in stores and malls. Some spending among high-net-worth individuals, especially the under-30 crowd, has shifted to Japan, where they are traveling to take advantage of a weak yen. Interestingly, we were told consumption in smaller cities has held up, particularly the households who were less affected by the property crisis. Despite recent challenges, we expect China to retain its importance as a top market for the likes of French companies LVMH and Hermès.
Bottom line
We invest in stocks on a company-by-company basis. Beyond fundamental analysis, we adjust the risk premium and valuation multiples we apply to those companies based on regulation, geopolitics and industry dynamics. Even accounting for the higher risk premium given these factors, we see value emerging in select industries and companies such as internet services, domestic leisure and travel, the EV supply chain and industrial automation.
Notwithstanding recent efforts at diversification, China is and will remain central to the global supply chain in many industries for the foreseeable future. As such, it’s imperative to monitor developments in China and see the companies, management teams and facilities firsthand. We believe investors have to adapt to the new reality, which is lower GDP growth (3%–5%) for China and fixing the country’s property market model. Despite these headwinds, we believe there are — and will continue to be — investment opportunities.
Explore topics
Statements attributed to an individual represent the opinions of that individual as of the date published and do not necessarily reflect the opinions of Capital Group or its affiliates. This information is intended to highlight issues and should not be considered advice, an endorsement or a recommendation.
The indexes are unmanaged and, therefore, have no expenses. Investors cannot invest directly in an index.
Standard Deviation is a common measure of volatility that gauges how returns have varied from a mean over time. A lower number indicates lower volatility.
Cash and equivalents include short-term securities, accrued income and other assets less liabilities. It may also include investments in money market accounts or similar funds managed by the investment advisor or its affiliates that are not offered to the public.
MSCI China Index captures large- and mid-cap representation across China A shares, H shares, B shares, Red chips, P chips and foreign listings (e.g. ADRs).
MSCI Emerging Markets Index is a free-float-adjusted market-capitalization-weighted index designed to measure equity market results in the global emerging markets, consisting of more than 20 emerging market country indexes.
MSCI USA Index is a free-float-adjusted, market-capitalization-weighted index that is designed to measure the U.S. portion of the world market.
MSCI has not approved, reviewed or produced this report, makes no express or implied warranties or representations and is not liable whatsoever for any data in the report. You may not redistribute the MSCI data or use it as a basis for other indices or investment products.
Related Insights
Related Insights
-
-
Technology & Innovation
-