
Trade
Understanding tariffs in 5 charts
 Anne-Marie Peterson
 Arun Swaminathan
 David Polak
We see the early signs of a market rotation, from a narrow set of growth leaders to a broader array of companies. While investors are not bailing on Big Tech, many are concerned about concentration risk and excessive exposure to these companies in the market-cap-weighted indexes. It makes sense. We think investors should have exposure to the incumbent technology giants that have driven so much of the growth in the U.S. economy, but also a broader set of companies and industries that have strong business models and potential for a long runway for growth ahead.
Here we share thoughts on investment opportunities recognized by the market that we think will persist, as well as some other areas and themes of potential growth.
Historically, scale has been an impediment to growth. That’s not the case with the Big Tech companies as they have generated returns on very low incremental investments. Capital investment in these industries is focused on hardware and software, which are sunk costs. Then, as the business grows, margins have the potential to expand at the same time that volume increases. Meta demonstrated this a year ago. It laid off employees and accelerated revenue at the same time. In the second quarter of 2024, for instance, Meta reported revenue of $39 billion, a 22% rise over the previous year, while its operating margin rose from 29% to 38%.
Nvidia expanded its video gaming semiconductor franchise into AI, opening up a burgeoning market with little additional outlay. It has a huge advantage through its expertise in graphic processing units (GPUs) for large language models. Nvidia's sales catapulted from $11 billion in 2020 to $60 billion in fiscal 2024. However, these companies may not have big additional costs. After all, tech companies are expected to spend about $30 billion per year on building and powering data centers needed for semiconductor chips and other AI-related hardware. And if geopolitical imperatives lead to both the design and building of semiconductor chips in the U.S. and Europe, it could result in additional expenditures that may be partially subsidized by governments.
Overall, scale remains a big advantage for the megacap companies. Author and physicist Geoffrey West has written about the benefits and challenges of scale. He observes that large organisms take less energy to stay warm: Elephants and whales live a long time. As our colleague, Capital Group equity portfolio manager Carl Kawaja reminds us, the same is true of big cities. They build advantages of scale and are more cost-efficient per unit produced. This phenomenon has also held true for Big Tech companies; they have shown it is possible to do business in ways that are more virtual and less capital- and labor-intensive.
A broader ecosystem benefits from Big Tech
The phenomenal businesses that the Magnificent Seven and other large-cap companies have generated is undisputed, and as we have mentioned, value has continued to accrue to these companies, with market caps ballooning to trillions of dollars for many.
But beyond the companies themselves, there is a broader ecosystem of firms that supply their parts or provide infrastructure critical to the success of the megacap companies. In some ways, these firms provide avenues to access growth opportunities that we view as more probable and durable.
Profit growth outside Magnificent 7 has perked up
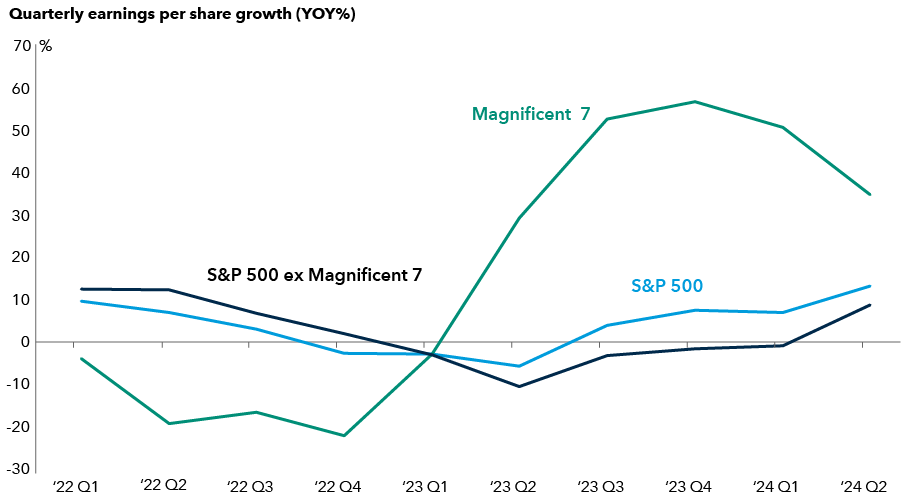
Source: Bloomberg. Data as of August 13, 2024. Past results are not predictive of results in future periods.
Prominent examples of this trend are companies all along the semiconductor value chain, including designers of chips, such as Avago (Broadcom), manufacturing foundries, such as TSMC, semiconductor equipment manufacturers, such as ASML and Tokyo Electron and Applied Materials, and silicon wafer design company Synopsys.
Companies involved in meeting the increasing needs for data centers and power generation, such as utility providers, may benefit as well. At the other end of the spectrum, early AI adopters could see greater interest from investors. Drug innovation is one example. Many pharma companies are now talking about AI. AstraZeneca and Roche, for instance, have demonstrated how they are leveraging AI tools for drug discovery and supply chain management.
Beyond the technology space, we look for industries and companies with strong moats — that is high barriers to entry, irreplaceable assets and growing demand. The industrial sector is vast and diverse, yet we are seeing companies with considerable industry dominance, solidifying and expanding their footprint in areas poised for potential long-term growth.
Industrials are benefiting from multiple tailwinds: The energy transition in the U.S., energy security in Europe, the reshoring of supply chains and increased defense spending. These multiyear trends are setting the stage for a capital investment super-cycle that could drive opportunity for a range of companies.
The U.S. has committed billions to infrastructure and renewable energy
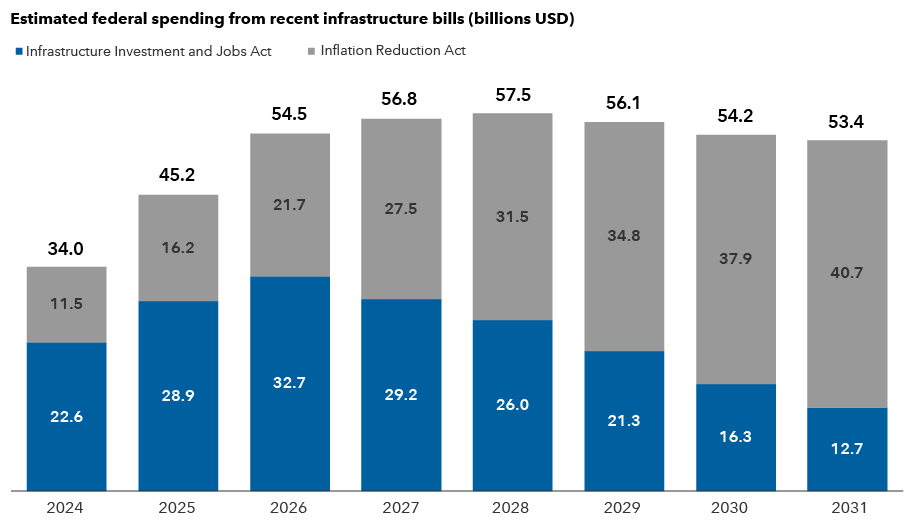
Sources: Capital Group, Congressional Budget Office (CBO). Figures above reflect total estimated federal outlays from the CBO as compiled by Capital Group. Totals may not add up due to rounding. CBO estimates for both bills are as of August 2022.
Take U.S.-based Eaton, which produces a broad range of electrical products and services for data centers, utility projects, industrial and commercial buildings, as well as fuel-efficient systems and safety components for commercial aircraft. In the second quarter of 2024, Eaton’s electrical business had a backlog of $11.4 billion, a figure that has grown steadily from $2.8 billion in the fourth quarter of 2019. Similarly, Schneider Electric, whose products help make commercial buildings more energy efficient, projects 7% to 10% annualized growth through 2027.
Renewable energy providers AES and NextEra are examples of companies that already have an advantage due to their extensive power infrastructure. Both are developing next-generation power-efficient solutions to meet global energy demands; they should also play a critical role supporting AI-driven data centers.
Data centers jolt demand for electricity
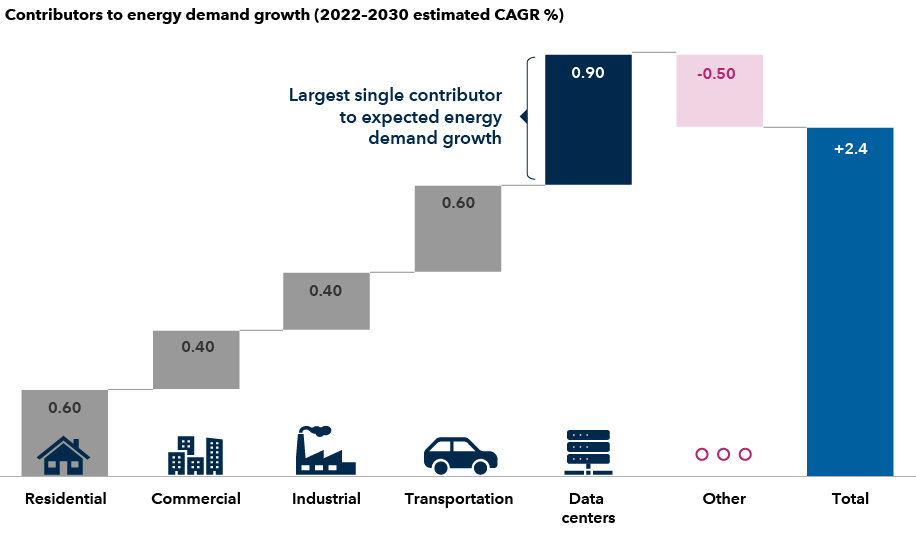
Sources: Goldman Sachs, U.S. Energy Information Administration. Estimates from Goldman Sachs as of April 28, 2024. CAGR is the compound annual growth rate. “Other” includes the impact of energy efficiency improvements and the change from categories not listed.
Aerospace and defense (A&D) is another segment of the industrial sector that may benefit in the near term from government orders and ongoing geopolitical conflicts. Countries including the U.K., France and Germany have boosted their defense spending, potentially spurring technological innovation in A&D-related products. Global military expenditures rose for the ninth consecutive year in 2023, reaching a total of $2.44 trillion — a 6.8% increase and the steepest year-on-year rise since 2009. Beneficiaries of this trend could include companies like Lockheed Martin, Raytheon and BAE Systems.
Industrial stocks as a group have been strong since 2016. They were further buffeted by supply chain constraints in the post-COVID period. So, valuations as a group may be on the high side, especially if we go into a period of slower global economic growth. That said, we would view any bouts of cyclical weakness as favorable entry points for select companies with long-term growth prospects.
We’ve written about this in the past as a multiyear theme, and we continue to view the broader health care space as an area with strong prospects. It’s an industry that long-term investors can’t ignore. In 2022, health care spending in the United States reached $4.5 trillion or 17.3% of GDP, according to the Centers for Medicare and Medicaid Services. Broader advances in technology, like greater connectivity and AI, are turbocharging the development of therapies.
We are in the early days of a third major wave of innovation in biotech and drug discovery. In the first wave, old-line chemical companies treated disease. The second wave was the emergence of protein-based therapeutics that were more targeted, harnessing the immune system to treat disease.
This third wave belongs to genetics. Health care companies, bolstered by insights from genetic sequencing done in recent years and the ability to process a wealth of data at faster speeds, have developed methods to more specifically intervene in the disease process. It’s an incredibly exciting time.
One key advancement is the development of technologies that allow intervention in disease pathways at the genetic level, further upstream than many conventional medicines. Through sequencing and data processing, drug developers can apply highly specific interventions like gene therapy, where normal genes can be transplanted in place of missing or defective ones to address the disease.
Health care stocks appear undervalued relative to broader market
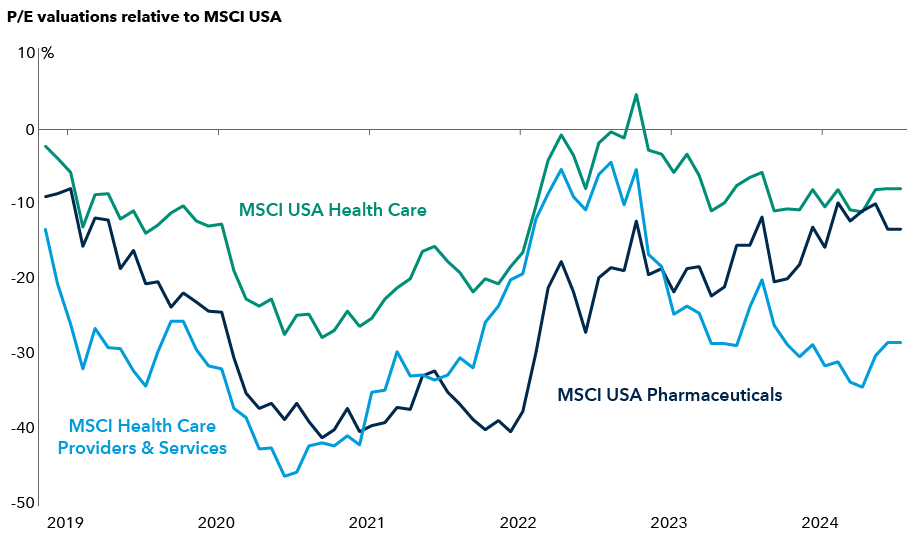
Sources: Capital Group, MSCI. Relative valuation is the ratio between the forward 12-month price-to-earnings (P/E) ratio of the MSCI USA Health Care Index, MSCI USA Health Care Providers & Services Index and MSCI USA Pharmaceuticals Index relative to the broader MSCI USA Index from January 31, 2019, through September 5, 2024. P/E for a stock is computed by dividing the price of a stock by the company's annual earnings per share. A value below zero indicates that health care sector index is relatively undervalued. Data as of September 5, 2024. Past results are not predictive of results in future periods.
Another emerging technology is RNAi therapeutics. RNAi is a natural biological process that regulates gene expression by interfering with messenger RNA (mRNA), which carries DNA’s instructions for making new proteins. Also, known as silent mRNA, these therapies “silence” the genes that cause or contribute to the disease. This will be important in addressing a range of diseases. Companies such as Alnylam have pioneered RNAi therapeutics, leading the path to treatments for lung cancer, and the next areas could be hypertension and high blood pressure.
The progress in gene editing systems, such as CRISPR, is also particularly interesting. Boston-based Vertex Pharmaceuticals achieved a significant milestone; they are the first company to receive approval from the U.S. Food and Drug Administration for a CRISPR-based therapy to treat sickle cell disease.
Companies have also become more disciplined in focusing on their area of expertise. Their focus on obesity drugs have given Eli Lilly and Novo Nordisk a first-mover advantage.
Investors poured an incredible amount of capital into the biotech and pharmaceutical industries over the past several years, driving innovations that resulted in the creation of intellectual property and know-how that will likely be improved upon for years to come. As such, there's potentially an explosion of new therapeutic opportunities coming over the next decade.
This theme spans industries. It requires years of industry consolidation, the right product lineup, refinement of the business model, and a strong management team. Companies that emerge as winners can witness substantial growth in both revenue and profits. It may not be a straight line in terms of the stock price and investor sentiment, but long-term investors may accrue significant value over time.
LVMH and Hermes are examples in the luxury space, where their business models for luxury items have so far been tough to upend. Similarly, the semiconductor manufacturing universe has consolidated so much since the 1990s that Taiwan’s TSMC manufactures 80% of the world’s most advanced computing chips.
Looking for examples across industries, Caterpillar has a hold on the heavy industrial equipment segment, Netflix has emerged as the leader in online streaming, and Meta and Google have a grip on the online advertising market. Costco has become dominant in the club-grocery business, having succeeded in exporting its business model to other countries. Airbus and Boeing have a duopoly in airplane frames, with orders in the pipeline stretching out a decade. Similarly, GE, Safran and Pratt & Whitney are chief suppliers of narrow-body aircraft engines. And miners like Freeport-McMoRan and BHP dominate copper mining, an increasingly rare mineral in heavy demand in several industries.
We also keep an eye out for companies that are getting or are at risk of getting displaced by the dominant providers. Over the years, several big-box retailers have been disrupted by Amazon, and we expect that health care companies that are slow to apply AI to drug innovation may be overtaken by those that do in the coming years.
We’d reiterate that the stocks of these companies may not be good investments in every environment, depending on a variety of factors including valuation, regulatory scrutiny, management changes and business challenges, such as those we are seeing with Boeing. But it’s a theme we always focus on, which means that companies with these characteristics will probably always be on our radar.
India is a rapidly growing economy with a vibrant private sector. Corporate management is of high quality and often on par with world-class companies. That said, India is in the initial stages of development in many areas with a sizeable number of small- and mid-sized companies whose stock prices have the potential to compound over the next decade.
Smaller companies with a market capitalization between $1 billion and $10 billion made up one-third of the $1.2 trillion MSCI India Index as of August 31, 2024. And opportunities are expanding in areas of manufacturing, chemicals and consumer-oriented businesses. India's booming economy, growing housing market and digital infrastructure are also creating fertile ground for small-cap companies to flourish.
India’s equity market has expanded in the mid-cap space
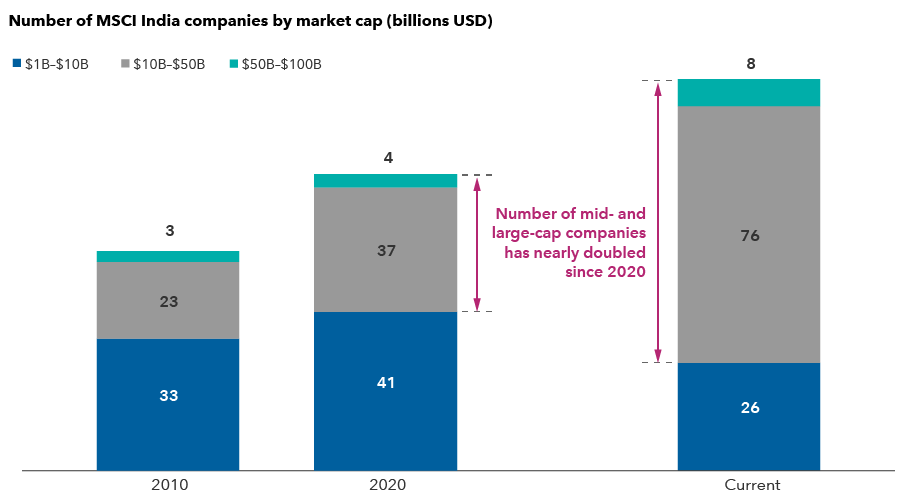
Sources: Capital Group, MSCI, RIMES. Data for 2010 and 2020 as of December 31, respectively. Current data as of August 31, 2024.
With significant government investment in infrastructure, India is also becoming a viable alternative to China for manufactured products, such as mobile phones, home appliances and computers. These factors have resulted in a larger opportunity set than a decade ago.
Take housing. India has fewer housing starts than the U.S. and 10,000 less than China. Given the opportunity, some housing developers provide good examples of companies that could benefit from infrastructure investment, especially those that specialize in suburban neighborhoods that are getting connected with an improving rail system.
Health care is another good example. With a population of over 1.4 billion, demand for health care remains high. While government hospitals cater to the poor, a rapidly growing middle class is demanding and willing to pay for quality health care combined with modern conveniences. In financials, there's also a new crop of wealth management firms, home mortgage lenders and mobile-based consumer finance platforms.
Overall, India is a market with potentially a long runway, not unlike what we saw in China more than two decades ago. While the contours of development will be quite different from China, India is on that early part of the development curve.
The growth paradigm has been dominated by Big Tech over the past few years. But the opportunity set is much broader, and given the concentration in the market, especially in the U.S., it’s incumbent on us to look at other areas of opportunity to construct robust, well-rounded portfolios with medium- to long-term horizons.
Some themes are clear, and it’s a matter of valuations. Others become more transparent over time. But having a broad set of themes, expressed through a range of companies, helps our pursuit of superior long-term returns while seeking to mitigate risk in our portfolios.
Sunk cost, in economics and finance, is a cost that has already been incurred and that cannot be recovered.
The Magnificent Seven – The seven largest contributors to the S&P 500 in 2023. The companies are Alphabet, Amazon, Apple, Meta Platforms, Microsoft, NVIDIA and Tesla.
MSCI USA Index is a free-float-adjusted, market-capitalization-weighted index that is designed to measure the U.S. portion of the world market.
The MSCI USA Health Care Index is designed to capture the large- and mid-cap segments of the U.S. equity universe. All securities in the index are classified in the health care industry.
MSCI USA Health Care Providers & Services Index is designed to capture the large- and mid-cap stocks of the U.S. equity market. All securities in the index are classified in the health care providers and services industry (within the health care sector) according to the Global Industry Classification Standard (GICS®).
MSCI India Index is designed to measure the performance of the large- and mid-cap segments of the Indian market.
The MSCI USA Pharmaceuticals Index is designed to capture the large- and mid-cap stocks of the U.S. equity market. All securities in the index are classified in the pharmaceuticals industry (within the health care sector) according to the Global Industry Classification Standard (GICS®).
The MSCI USA Pharmaceuticals Index and MSCI USA Health Care Providers & Services Index are subcomponents of the MSCI USA Health Care Index and only contain companies within each respective industry.
The S&P 500 Index is a market-capitalization-weighted index based on the results of 500 widely held common stocks.